NIFTY TECHNICAL OUTLOOK
Based on Market Closing on Wednesday, November 29, 2023
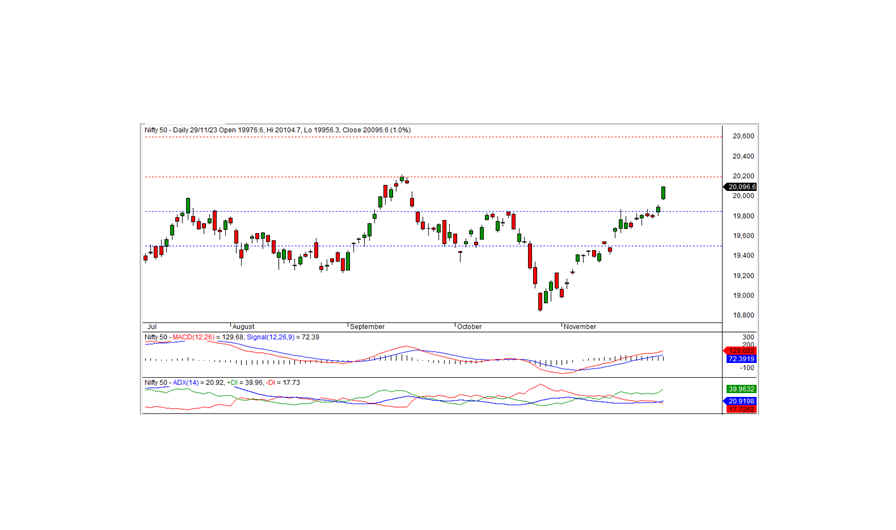
The Nifty concluded the trading session at 20,096.60, marking a gain of 206.90 points or 1.04 percent. The bullish momentum can persist if the index trades and sustains above 20,105.
The Nifty opened at the 19,976.60 level, exhibiting an upward gap. Before ascending further, the index touched a low of 19,956.30. Subsequently, the index continued its bullish trend, reaching an intraday high of 20,105 and ultimately closing at 20,096.60. Except for media and realty, all sectors closed on a positive note. The auto, bank, IT, and financial services sectors emerged as the most significant gainers. The market breadth was positive, with 1,196 stocks rising, 1,155 falling, and 130 remaining unchanged. Under the Nifty, AXISBANK, HEROMOTOCO, M&M, and WIPRO stood out as top gainers, while the major losers were ADANIENT, ONGC, DIVISLAB, and NESTLEIND.
From a technical standpoint, the Nifty remains above short-term and long-term moving averages. Momentum indicators also signal a positive trend. Moreover, the index formed a long white candle on the daily chart and closed near the day's high. On the upside, the index faces intraday resistance at 20,105 levels. If the index surpasses this level, the bullish momentum may extend in the coming days. The next short-term resistance remains at 20,200 levels. A close above this level may lead to the next resistance level of 20,600.
Intraday Levels (15-Minute Charts): Support: 20,025 - 19,950 - 19,900 Resistance: 20,105 - 20,175 - 20,250
Positional Trading: Short-term Support: 19,850 - 19,500 Resistance: 20,200 - 20,600

BANK NIFTY
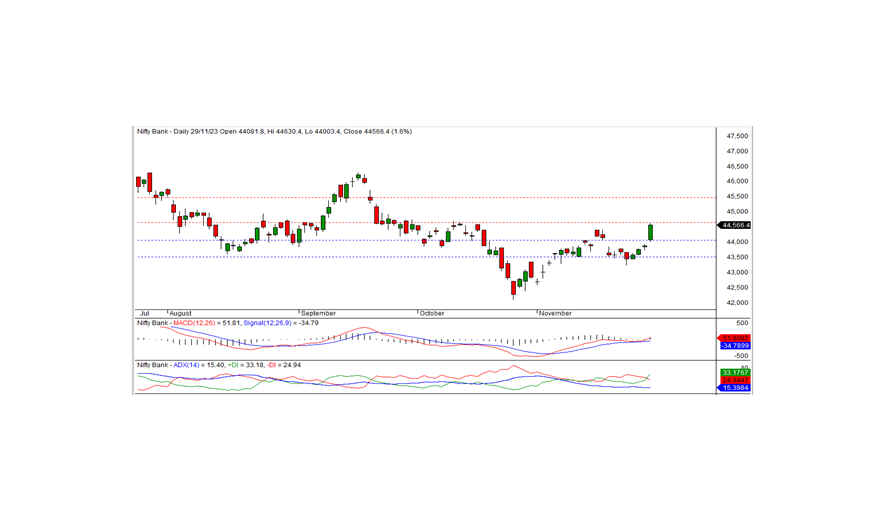
In the previous trading session, Bank Nifty concluded at 44,566.45, marking a gain of 685.50 points. From a technical standpoint, momentum indicators signal a positive trend, and the index remains positioned above both short-term and long-term moving averages. Notably, the daily chart displays a long white candle, closing near the resistance of 44,650. These factors collectively suggest that the momentum continues to favor the bulls. A breakthrough beyond the 44,650 level could sustain the bullish trend in the coming days, with the next short-term resistance located at 45,500.
For intraday traders, support levels are observed at 44,400, 44,200, and 44,000, while resistance levels are identified at 44,650, 44,850, and 45,000, as indicated by the 15-minute charts.
Positional traders are advised to monitor short-term support levels at 44,000-43,500, with resistance noted at 44,650 - 45,500.

