NIFTY TECHNICAL ANALYSIS
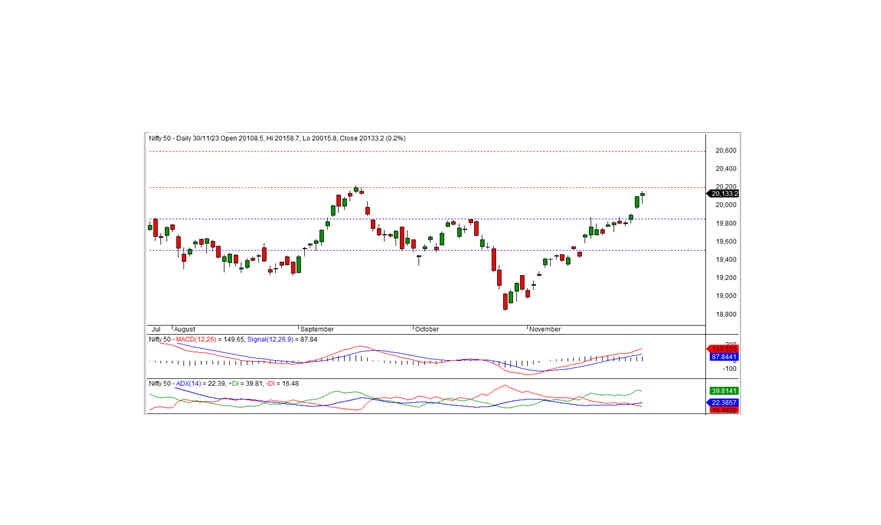
As of the market close on Thursday, November 30, 2023, the Nifty concluded the trading session at 20,133.20, registering a gain of 36.55 points or 0.18 percent. Sustained bullish momentum is anticipated if the index continues to trade above 20,125.
Commencing at 20,108.50 with a positive bias, the Nifty initially experienced a dip, reaching an intraday low of 20,015.80. However, during afternoon trading, the index rebounded, reaching an intraday high of 20,158.70 before settling at 20,133.20. Noteworthy sector gainers included pharma, realty, FMCG, and media, whereas banking and IT faced losses. Market breadth favored positivity, with 1,208 stocks rising, 1,164 falling, and 113 remaining unchanged.
Leading the gainers under the Nifty were ULTRACEMCO, HDFCLIFE, EICHERMOT, and SUNPHARMA, while ADANIENT, ADANI PORTS, INDUSINDBK, and POWERGRID were among the major losers.
From a technical perspective, the Nifty maintains positions above both short-term and long-term moving averages. Momentum indicators reinforce a positive trend, supported by the formation of a white candle on the daily chart, closing above the previous day's close. Intraday support is observed at 20,125, and the sustainability above this level is pivotal for the continuation of bullish momentum. The next short-term resistance is anticipated at 20,200, with a successful breach potentially leading to the next resistance level at 20,600.
Intraday Support Levels: 20,125 - 20,050 - 19,950 Resistance Levels: 20,200 - 20,275 - 20,325 (15-Minute Charts)
For positional traders, short-term support levels are identified at 19,850 - 19,500, while resistance is positioned at 20,200 - 20,600.

BANK NIFTY UPDATE
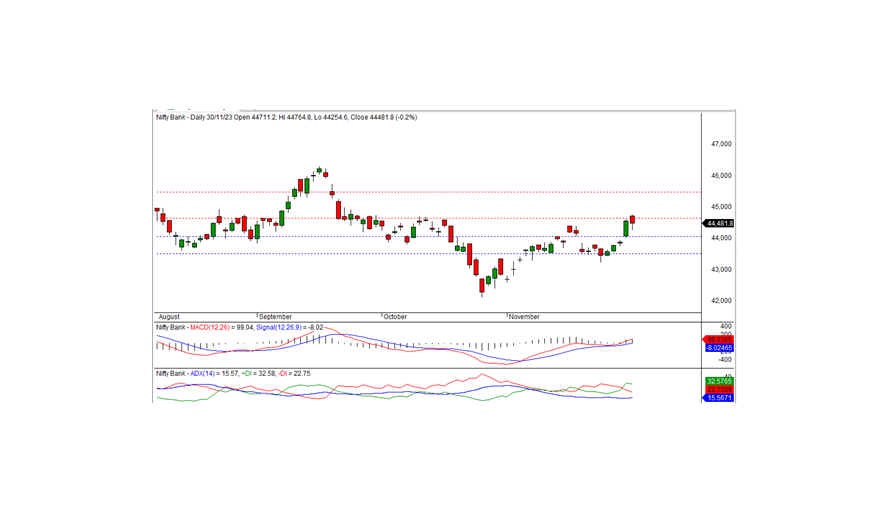
In the previous trading session, Bank Nifty concluded at 44,481.75, marking a loss of -84.70 points. From a technical standpoint, momentum indicators signal a positive trend, and the index maintains positions above both short-term and long-term moving averages. However, the daily chart reveals the formation of a black candle. The index tested the short-term resistance at 44,650 but closed below the previous day's close, suggesting a slightly negative bias. A breakthrough above the resistance of 44,650 could sustain the bullish trend in the coming days. Conversely, the index might consolidate below this level for a brief period.
For intraday traders, support levels are identified at 44,280, 44,085, and 43,930, while resistance levels are observed at 44,500, 44,730, and 44,950, as indicated by the 15-minute charts.
Positional traders are advised to monitor short-term support levels at 44,000-43,500, with resistance located at 44,650 - 45,500

