NIFTY TECHNICAL OUTLOOK
Based on Market Closing on Tuesday, January 16, 2024
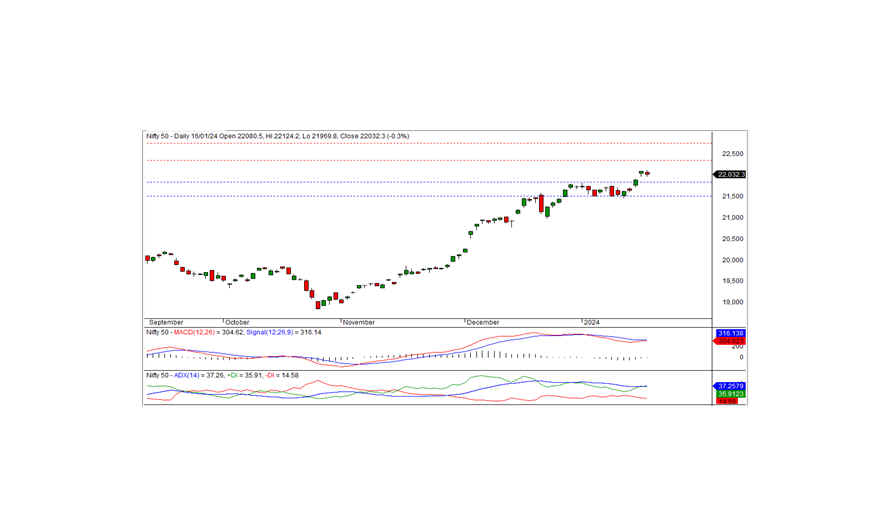
In the last trading session, the Nifty closed at 22032.30, down by -65.15 points or -0.29 percent. The downward bias will persist if the Nifty trades and sustains below the 21975 level.
The Nifty opened at the 22080.50 level with a negative bias, and rebounded to hit the record high of 22031.50. However, the index failed to maintain momentum, gradually falling to hit the intraday low of 21969.80 before closing at 22032.30. The notable sector gainers were in metal, media, PSU banks, and FMCG, while realty, IT, pharma, and auto witnessed significant losses. Market breadth leaned negative, with 789 stocks rising, 1646 falling, and 82 remaining unchanged. Under the Nifty, BPCL, TATA STEEL, TITAN, and ITC were the top gainers, whereas DIVISLAB, HCLTECH, WIPRO, and NTPC faced notable losses.
From a technical standpoint, the Nifty remains above short-term moving averages. Momentum indicators suggest a neutral trend. The index formed a small black candle on the daily chart, closing below the previous day's close, indicating the potential for consolidation. The nearest intraday support is at the 21975 level. If the Nifty moves below this level, the downtrend may continue today. Otherwise, the index may consolidate above this level. The index needs to surpass the resistance at the 22125 level to continue the bullish trend.
Intraday Support levels: 21975-21900-21830 Resistance levels: 22055-22125-22200 (15-Minute Charts)
Positional traders' short-term levels: Support at 21835-21500 Resistance at 22350-22750

BANK NIFTY
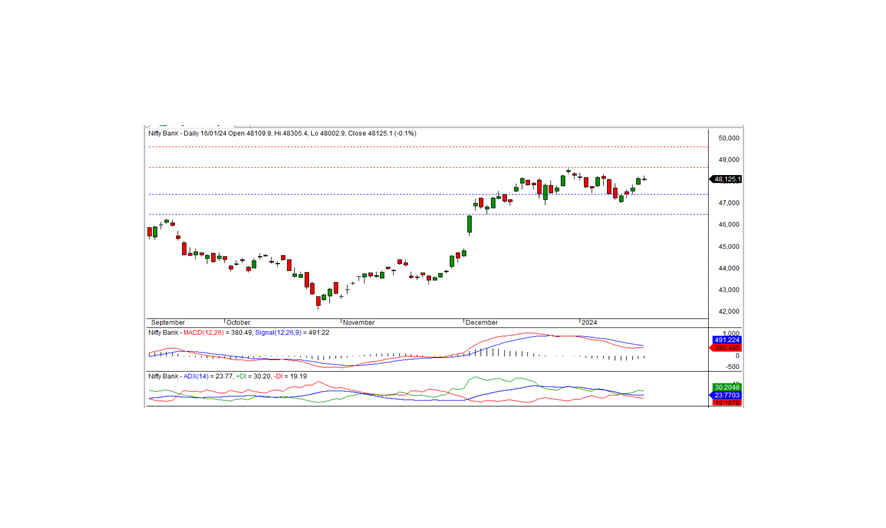
In the preceding trading session, Bank Nifty closed at 48125.10, marking a loss of -33.20 points. From a technical perspective, momentum indicators signal a neutral trend, while the index remains positioned above both short-term and long-term moving averages. The index formed a Doji candle on the daily chart and closed just below the previous day's close. On the downside, the index has intraday support at the 48000 level; if it moves below this level, the negative trend may persist today. The nearest intraday resistance is at 48175 levels. To establish a positive trend, the index must surpass this level.
For intraday traders, support levels are identified at 48000, 47850, and 47650, while resistance levels can be found at 48175, 48300, and 48500, as indicated by the 15-minute charts.
Positional traders are advised to monitor short-term support levels at 47400-46500, with resistance noted at 48650-49700.

