NIFTY TECHNICAL OUTLOOK
As of the market close on Wednesday, January 10, 2024
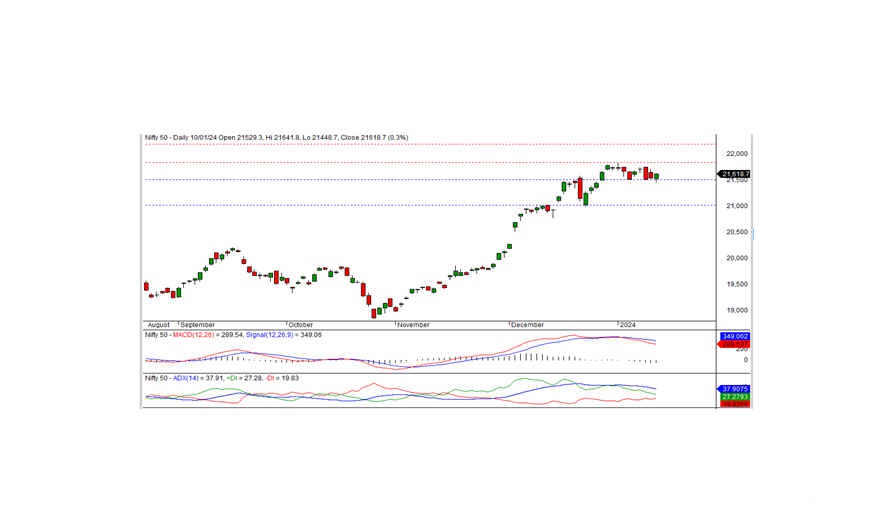
During the previous trading session, the Nifty concluded at 21618.70, marking a gain of 73.85 points or 0.34 percent. The ongoing consolidation may persist for the next few days if the Nifty maintains a position above the support level of 21500.
Commencing at 21529.30 in the negative, the Nifty experienced an intraday low of 21448.70. Subsequently, the index gradually ascended, reaching an intraday high of 21641.80 before settling at 21618.70. Leading the sector gainers were media, metal, IT, and private banks, while FMCG, PSU banks, and realty faced declines. The market exhibited positive breadth, with 1296 stocks advancing, 1101 declining, and 117 holding steady. Notable performers beneath the Nifty included CIPLA, ADANIENT, RELIANCE, and HCLTECH as top gainers, with ONGC, DIVISLAB, NTPC, and BPCL among the major losers.
From a technical standpoint, the Nifty closed above short-term moving averages, with momentum indicators signaling a neutral trend. Noteworthy is the formation of a white candle on the daily chart, closed near the day's peak, indicating a positive bias. Over the last few trading sessions, the index has been consolidating within the trading band 21450-21835. This consolidation may continue for a few more days. A direction can only be determined if the index breaks out of either of these levels.
Intraday Support Levels: 21550-21475-21400 Resistance Levels: 21650-21725-21800 (15 Minute Charts)
For positional traders, short-term support levels are maintained at 21500-21000, with resistance at 21835-22200.

BANK NIFTY
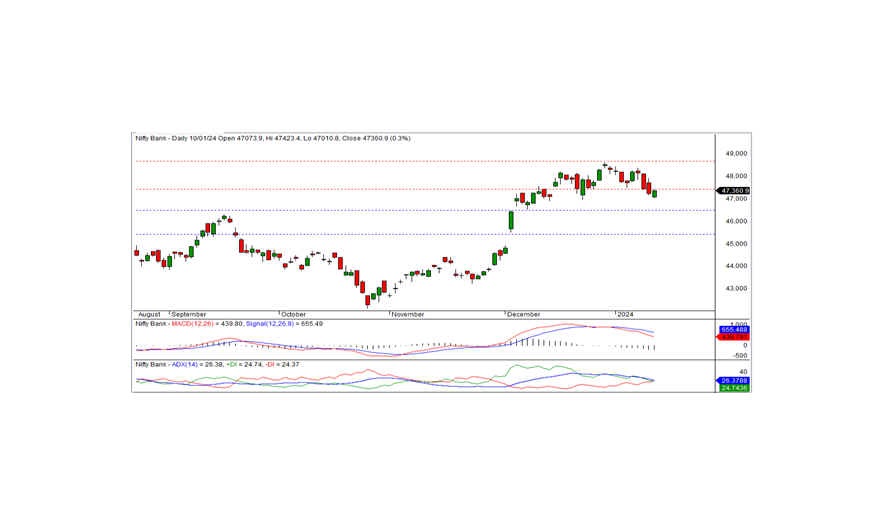
In the preceding trading session, Bank Nifty concluded at 47360.85, marking a gain of 118.20 points. Assessing the technical perspective, momentum indicators point towards a negative trend, and the index remains positioned below short-term moving averages. Nevertheless, a white candle formation on the daily chart, coupled with a close near the short-term resistance of 47400, suggests the potential for a positive trend. Failure to breach this level may result in a resumption of the recent downtrend.
For intraday traders, support levels are identified at 47200, 47000, and 46800, while resistance levels can be observed at 47400, 47600, and 47800, as indicated by the 15-minute charts.
Positional traders are advised to monitor short-term support levels at 46500-45400, with resistance observed at 47400 - 48650.

