NIFTY TECHNICAL OUTLOOK - February 13, 2024
Based on Market Closing on Monday, February 12, 2024
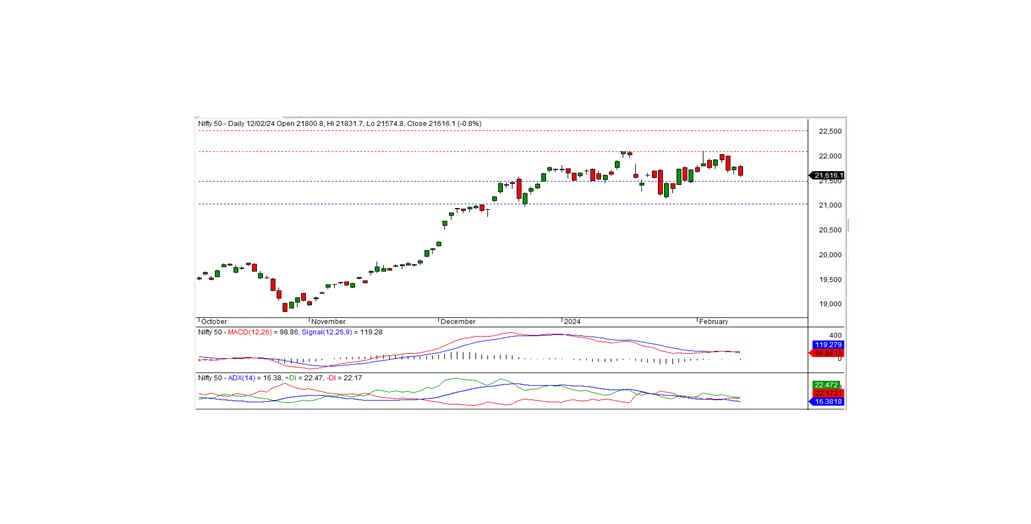
The Nifty concluded at 21616.05, marking a decline of -166.45 points or -0.76 percent. The bearish sentiment persists if the Nifty continues to trade below the intraday support level of 21600.
Commencing at 21800.80 with a positive bias, the Nifty reached an intraday high of 21831.70 during morning trade. Subsequently, the index gradually descended, hitting an intraday low of 21574.80 before settling at 21616.05. Apart from IT and pharma, all sectors closed with a negative bias, notably media, PSU banks, realty, and metal sectors registering significant losses. Market breadth leaned negative, with 455 stocks rising, 1985 falling, and 89 remaining unchanged. Noteworthy gainers under the Nifty include DRREDDY, APOLLOHOSP, DIVISLAB, and WIPRO, whereas major losers encompass COALINDIA, HEROMOTOCO, BPCL, and ONGC.
Technically, the Nifty concluded below both medium and short-term moving averages, with momentum indicators signaling a negative trend. Moreover, the index formed a black candle on the daily chart, closing near the day's low. On the downside, the index finds intraday support at the 21600 level, and should it trade and sustain below this mark, the negative trend may persist. The nearest intraday resistance stands at 21700; a surpassing of this level is necessary for a potential pullback rally.
Intraday Levels (15-Minute Charts): Support levels - 21600-21500-21400 Resistance levels - 21700-21800-21900
For positional traders, short-term support levels are situated at 21500-21000, with resistance noted at 22125-22500.

BANK NIFTY
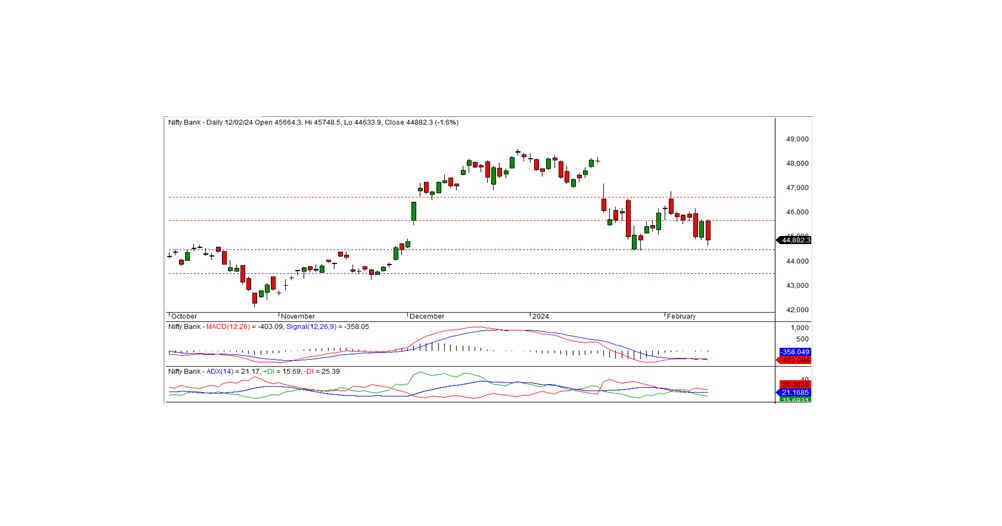
In the previous trading session, Bank Nifty concluded at 44882.25, marking a decline of -752.30 points. Technically, momentum indicators suggest a negative trend, with the Nifty closing below both short-term and long-term moving averages. Furthermore, the index formed a black candle on the daily chart, closing near the session's low.
The nearest intraday support is situated at the 44700 level. Should the index breach this level, the downtrend may persist in the forthcoming days. Conversely, a pullback rally could materialize from the support region. The closest intraday resistance lies at the 45000 levels.
For intraday traders, support levels are identified at 44700, 44450, and 44200, with resistance levels at 45000, 45350, and 45600, as indicated by the 15-minute charts.
Positional traders are advised to monitor short-term support levels at 44450-43500, while resistance is noted at 45600 - 46600.

