
NIFTY TECHNICAL OUTLOOK
Based on Market Closing on Wednesday, March 20, 2024.
In the latest trading session, the Nifty concluded at 21839.10, marking a modest increase of 21.65 points or 0.01 percent. To establish a positive trajectory, the index needs to surpass the resistance level of 21850.
During the session, the Nifty commenced trading at 21843.90 with a positive sentiment. However, it experienced a decline, reaching an intraday low of 21710.20 in the morning session. Subsequently, the index gradually rebounded, reaching an intraday high of 21930.90 before settling at 21839.10. Notable sectoral gainers included realty, FMCG, auto, and PSU banks, while metal, private banks, financial services, and pharma witnessed significant losses. The market breadth leaned negative, with 1008 stocks rising, 1464 falling, and 94 remaining unchanged. Leading gainers within the Nifty were EICHERMOT, MARUTI, POWERGRID, and NESTLEIND, whereas prominent losers encompassed TATASTEEL, TATACONSUM, TATAMOTORS, and AXISBANK.
From a technical perspective, the Nifty continues to trail below short-term moving averages, with momentum indicators signaling a negative trend. The formation of a Doji candle on the daily chart, coupled with a close just above the prior day's level, reflects uncertainty among market participants. Notably, the index faces short-term resistance at the 21850 level. A sustained trade above this threshold could extend the positive momentum in the ensuing days. Conversely, a failure to breach this level may prompt a resumption of the recent downtrend. The nearest intraday support is situated at 21810 levels.
Intraday Levels: Support - 21810, 21720, 21650 Resistance - 21925, 22000, 22080 (Based on 15-Minute Charts)
Positional Trading: Short-term support - 21200-20750 Resistance - 21850- 22500.
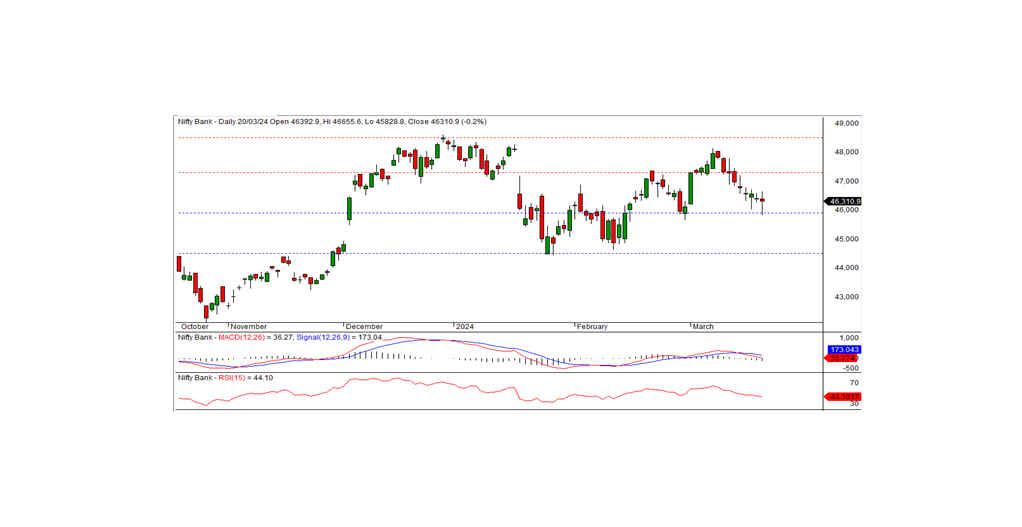
BANK NIFTY
During the previous trading session, Bank Nifty concluded at 46310.90, marking a loss of -73.90 points. Technically, momentum indicators continue to indicate a negative trend, with the index persisting below short-term moving averages. Additionally, the formation of a Doji candle on the daily chart, coupled with a close below the prior day's level, suggests the potential for a sustained downtrend. The immediate intraday support is situated at the 46250 level, while resistance is observed at 46500. A breach below 46250 could extend the ongoing downtrend. Conversely, a rebound necessitates surpassing the 46500 level.
For intraday traders, support levels are identified at 46250, 46100, and 45900, with resistance levels noted at 46500, 46700, and 46900, as indicated by the 15-minute charts.
Positional traders are advised to monitor short-term support levels between 46000-44500, with resistance anticipated at 47000-48500.
