NIFTY TECHNICAL OUTLOOK
Based on Market Closing on Friday, February 09, 2024
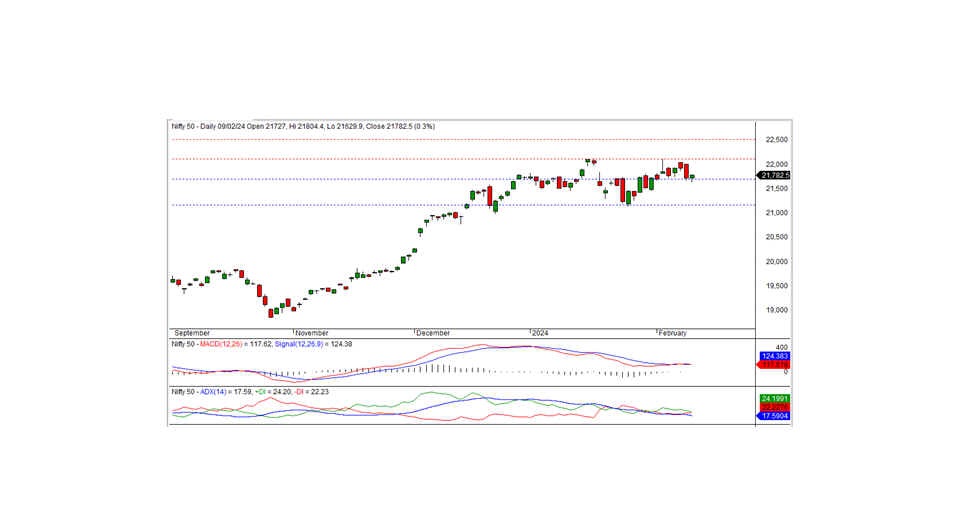
During the last trading session, the Nifty concluded at 21782.80, marking a gain of 64.55 points or 0.37 percent. The positive trajectory is anticipated to persist should the Nifty maintain trading above the intraday resistance level of 21800.
Initiating at the 21727.00 mark with a positive bias, the Nifty initially dipped to an intraday low of 21629.90 before gradually ascending to reach an intraday peak of 21804.40, ultimately settling at 21782.80. Noteworthy sector gainers included banks, financial services, pharmaceuticals, and FMCG, while notable sector losers comprised metals, IT, and auto. The market breadth displayed a negative trend, with 721 stocks advancing, 1719 declining, and 89 remaining unchanged. Among the Nifty constituents, GRASIM, SBIN, APOLLOHOSP, and SUNPHARMA were the top gainers, while major decliners included M&M, ONGC, BHARTIARTL, and NTPC.
Technically, the Nifty continues to trade above the medium and long-term moving averages, with momentum indicators signaling a favorable trend. Additionally, the index formed a white candle on the daily chart and concluded above the preceding day's close. The intraday resistance is situated at the 21800 level if the index trades and sustains above this threshold a positive trend can be expected today. The nearest short-term support resides at the 21750 levels.
For intraday trading, support levels are identified at 21725-21650-21550, with resistance levels at 21800-21900-22000 (15 Minute Charts). Positional traders are advised that short-term support levels are positioned at 21750-21160, while resistance is observed at 22125-22500.
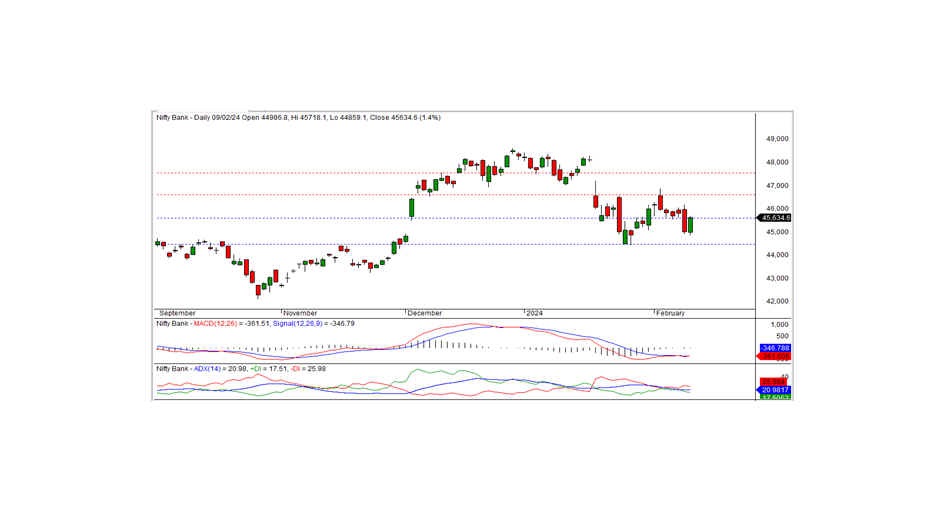
BANK NIFTY
During the previous trading session, Bank Nifty concluded at 45634.55, marking an increase of 622.55 points. From a technical standpoint, the momentum indicators suggest a negative trend, while the moving averages depict a mixed trend. Nonetheless, the index formed a white candle on the daily chart and closed higher than the previous day's close, signaling positive momentum. The positive momentum can continue If the index remains above the 45600 level. The next short-term resistance is at the 46600 level.
For intraday traders, support levels are identified at 45520, 45250, and 45000, with resistance levels at 45725, 46050, and 46300, as per the 15-minute charts.
Positional traders are advised to monitor short-term support levels at 45600-44450, with resistance levels observed at 46600-47500