NIFTY TECHNICAL OUTLOOK
Based on Market Closing on Tuesday, April 23, 2024
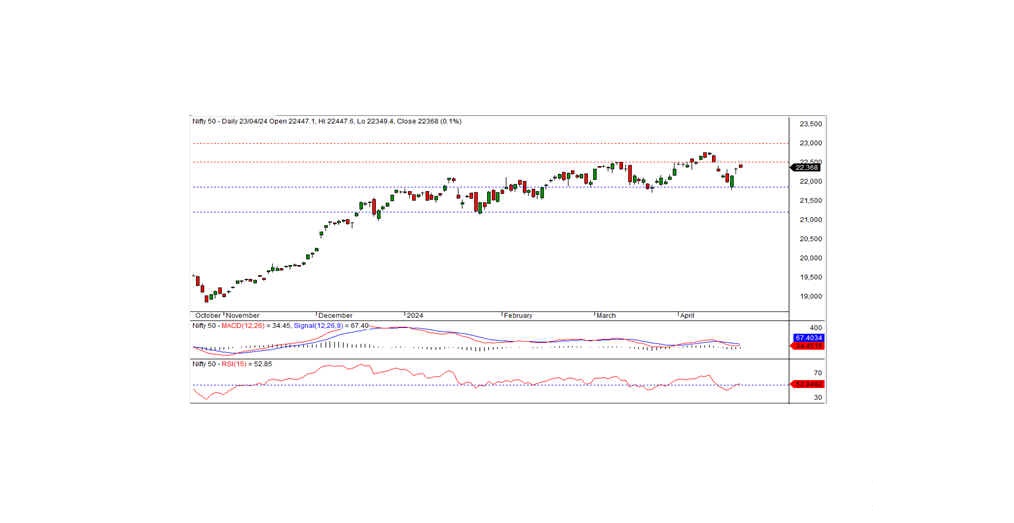
During the last trading session, the Nifty closed at 22368.00, marking an increase of 31.60 points or 0.14 percent. The positive trend is likely to persist if the Nifty continues to trade above the intraday support level of 22340.
In the last trading session, the Nifty opened at 22447.10, in a positive bias. However, the index gradually declined, reaching the intraday low of 22349.40 before closing at 22368.00. Except for the pharma and metal sectors, all others closed positively. Notable gainers included realty, FMCG, media, and IT sectors. The market breadth was positive, with 1563 stocks rising, 920 falling, and 116 remaining unchanged. Among the top gainers under the Nifty were GRASIM, BHARTIARTL, NESTLEIND, and MARUTI, while major losers included SUNPHARMA, BPCL, RELIANCE, and M&M.
From a technical perspective, the Nifty remains above the short-term and medium-term moving averages. However, momentum indicators signal a negative trend. The formation of a black candle on the daily chart, and a close above the previous day's close, suggests the possibility of the uptrend continuing. On the downside, the index has intraday support at 22340. The positive trend may persist if the index trades and stays above this level. The nearest intraday resistance remains at 22450 levels.
Intraday Levels: Support - 22340, 22250, 22155 Resistance - 22450, 22550, 22660 (15-Minute Charts)
Positional Trading: Short-term support - 21850-21200 Resistance - 22500-23000.
BANK NIFTY
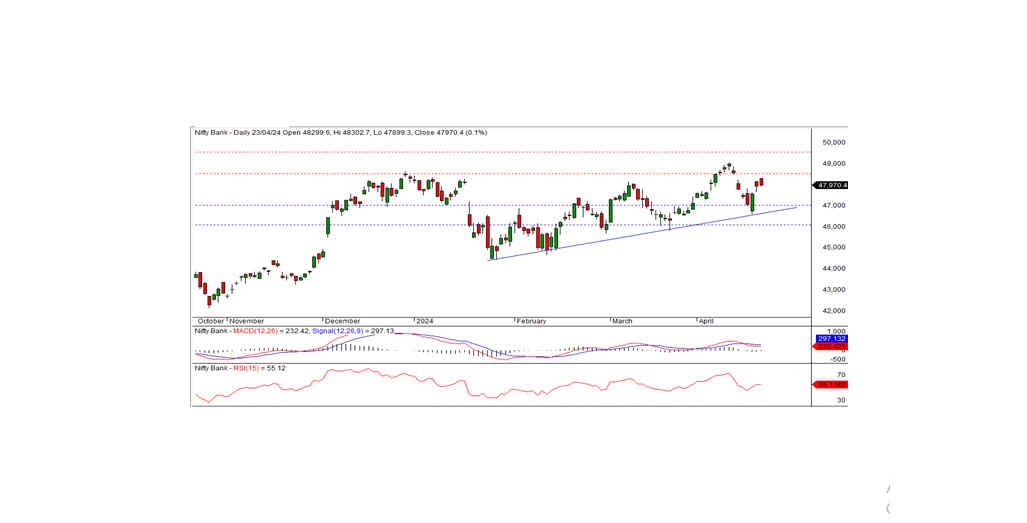
In the preceding trading session, Bank Nifty closed at 47970.45, marking a gain of 45.55 points. Technically, momentum indicators signal a neutral trend, however, the index remains above the short-term moving averages. Although a black candle formed on the daily chart, the close was above the previous day's, suggesting continued bullish momentum. The nearest intraday support is at 47870, while resistance stands at 48100. To sustain the uptrend, the index must surpass the resistance level of 48100.
For intraday traders, support levels are identified at 47870, 47625, and 47400, with resistance levels at 48100, 48300, and 48530, as per the 15-minute charts.
Positional traders should monitor short-term support levels at 47000-46000, with resistance at 48500-49500.