NIFTY TECHNICAL ANALYSIS
Based on Market Closing on Friday, April 19, 2024
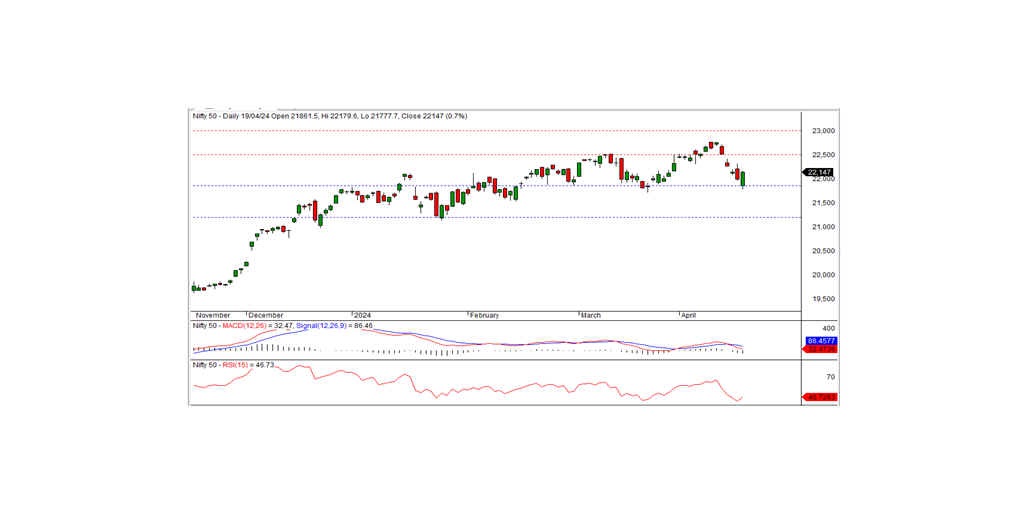
In the previous trading session, the Nifty concluded at 22147.00, reflecting a rise of 151.15 points or 0.69 percent. Positive momentum is expected if the Nifty maintains trading above the intraday resistance mark of 22200.
Commencing at 21861.50, the Nifty initially experienced a downturn, reaching an intraday low of 21777.70. Subsequently, it steadily climbed, peaking at 22179.60 before settling at 22147.00. Noteworthy gains were observed in the financial services, private banks, Nifty Banks, and the metal sector, while the major losers were media, realty, pharma, and IT. The market breadth leaned towards negativity, with 1025 stocks ascending, 1422 declining, and 148 remaining unchanged. Prominent performers within the Nifty were BAJFINANCE, M&M, MARUTI, and HDFCBANK, whereas notable underperformers included BAJAJ-AUTO, HCLTECH, NESTLEIND, and DIVISLAB.
From a technical perspective, the Nifty continues to trail below both short-term and medium-term moving averages, with momentum indicators signaling a negative trajectory. Yet, the index displayed a significant uptick, forming a long white candle on the daily chart and concluding near the day's peak. This pattern, which looks like a piercing line candle, suggests a potential continuation of the upward trend. On the higher side, the index has intraday resistance at 22200. The positive trend can continue today if the index trades and sustains above this level. The closest intraday support stands at 22100.
Intraday Levels: Support - 22100, 21960, 21850 Resistance - 22200, 22300, 22430 (15-Minute Charts)
Positional Trading: Short-term Support - 21850-21200 Resistance - 22500-23000.
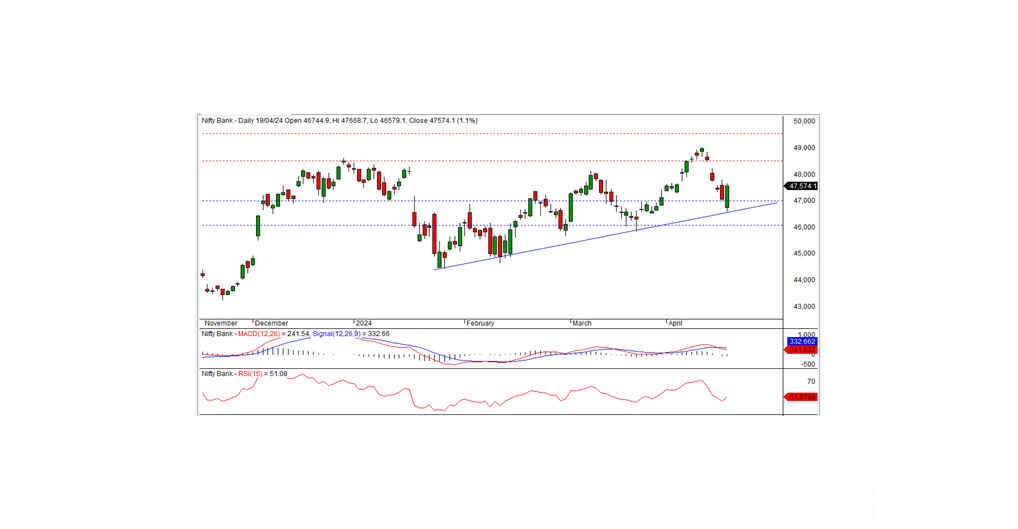
BANK NIFTY OUTLOOK
In the previous trading session, Bank Nifty concluded at 47574.10, marking a gain of 504.70 points. From a technical standpoint, momentum indicators are signaling a negative trajectory, with the index situated below short-term moving averages. Nonetheless, the index exhibited strength, forming a long white candle on the daily chart and concluding near the day's peak.
Sustained positivity is anticipated if the index breaches the intraday resistance level of 47750. Conversely, the closest intraday support stands at the 47370 level.
For intraday traders, support levels are identified at 47370, 47000, and 46700, while resistance levels are indicated at 47750, 48100, and 48400, as depicted by the 15-minute charts.
Positional traders are advised to monitor short-term support levels within the range of 47000-46000, with resistance levels positioned at 48500-49500.