NIFTY TECHNICAL OUTLOOK
Based on Market Closing on Thursday, February 29, 2024
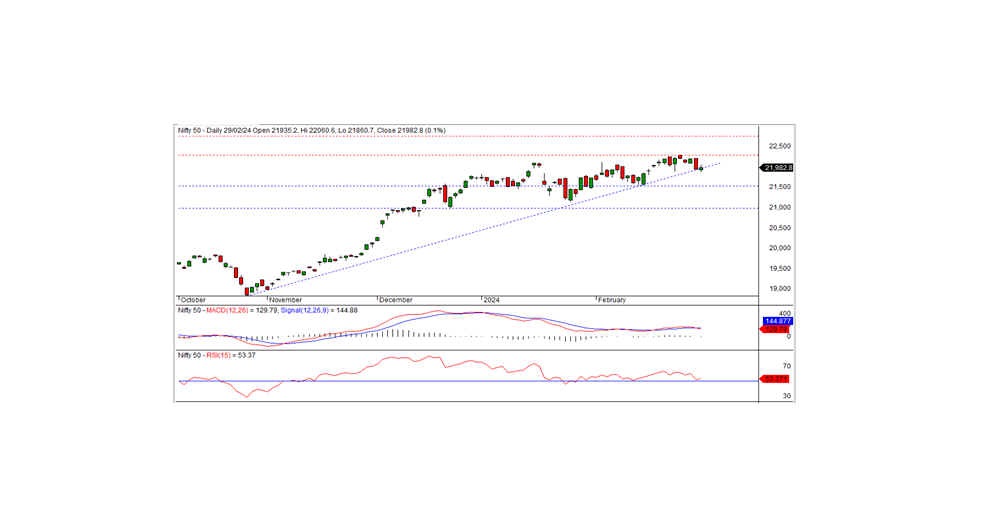
In the last trading session, the Nifty closed at 21982.80, marking a gain of 31.65 points or 0.14 percent. The positive trajectory may extend if the Nifty maintains trading levels above 21970.
The Nifty commenced the session at 21935.20 with a bearish tone, hitting an intraday low of 21860.70 during morning trading. However, the index steadily climbed, reaching an intraday high of 22060.60 before settling at 21982.80. Except for media and IT, all sectors closed with a positive bias. Banks, metals, FMCG, and financial services emerged as the major sector gainers. Market breadth leaned negative, with 1152 stocks advancing, 1296 declining, and 101 remaining unchanged. Notably, ADANIENT, TATACONSUM, INDUSINDBK, and M&M led the gainers, while APOLLOHOSP, BAJAJ-AUTO, LTIM, and EICHERMOT were among the major losers.
Technically, the Nifty remains positioned below short-term moving averages, while momentum indicators suggest a neutral trend. Nonetheless, the index formed a small white candle on the daily chart, closing above the previous day's level, signaling a mild positive bias. The immediate intraday support is at 21970; sustaining above this mark could reinforce the positive trend. The intraday resistance is anticipated at 22060.
Intraday Levels: Support: 21970-21880-21800 Resistance: 22060-22140-22225 (15 Minute Charts)
For positional traders, short-term support levels are observed at 21500-21000, while resistance is identified at 22300-22750.
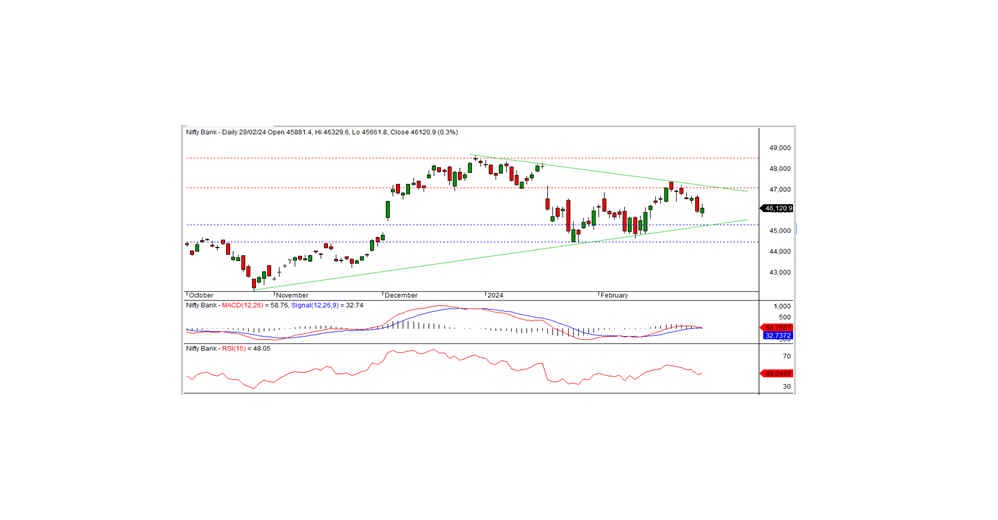
BANK NIFTY OUTLOOK
In the preceding trading session, Bank Nifty closed at 46120.90, marking a gain of 157.75 points. Technically, momentum indicators suggest a neutral trend, with the index positioned below both short-term and medium-term moving averages. However, the formation of a white candle on the daily chart, closing above the previous day's level, hints at a potential positive bias.
On the downside, the index finds intraday support at 46000, while resistance is observed at 46300. Should the index breach the 46300 level, the positive momentum may persist in the upcoming sessions; otherwise, a slight negative trend could manifest today.
For intraday traders, support levels are noted at 46000, 45750, and 45500, with resistance levels identified at 46300, 46570, and 46800, as per the 15-minute charts.
Positional traders are advised to monitor short-term support levels at 45300-44450, while resistance levels stand at 47000-48500.