NIFTY TECHNICAL OUTLOOK
Based on Market Closing on Wednesday, March 27, 2024
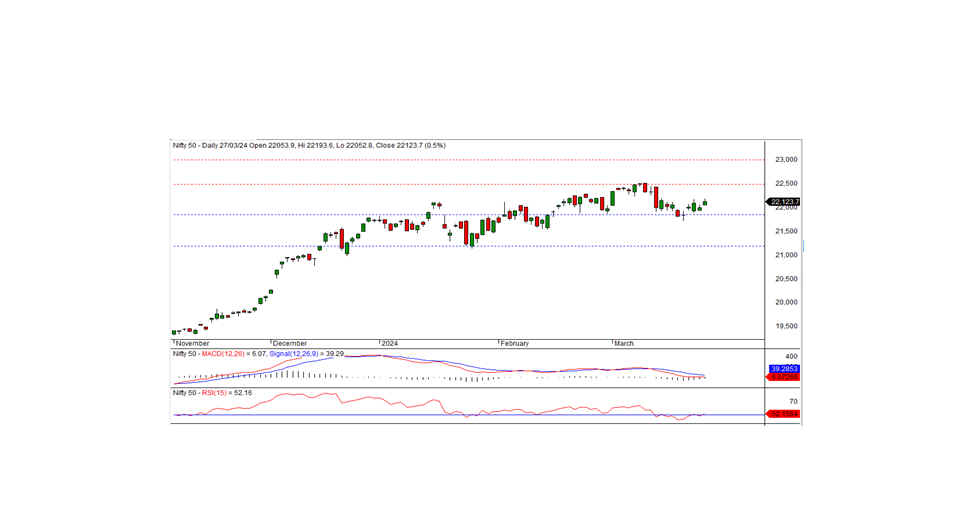
In the recent trading session, the Nifty closed at 22,123.65, marking an increase of 118.95 points or 0.54 percent. The positive trajectory is expected to persist as long as the Nifty remains above the 22,100 level.
In the last trading session, the Nifty opened at the 22053.90 level on a positive note and this trend continued and tested the intraday high 22193.60 and finally closed at 22123.65. Notably, sectors such as realty, private banking, automotive, and financial services exhibited gains, whereas PSU banks, IT, media, and FMCG witnessed declines. The market breadth trended negative, with 999 stocks advancing, 1455 declining, and 116 remaining unchanged. Key gainers within the Nifty included RELIANCE, BAJAJ-AUTO, MARUTI, and TITAN, while prominent losers encompassed UPL, HEROMOTOCO, TATACONSUM, and WIPRO.
From a technical perspective, the Nifty closed above its short-term moving average. While momentum indicators hint at a negative trend, the formation of a white candle on the daily chart coupled with a close above the previous day's level suggests a favorable bias. On the lower side, the index has intraday support at the 22100 level, and sustaining trade above this level could extend the positive momentum in forthcoming sessions. The subsequent short-term resistance resides around the 22,500 level.
Key Intraday Levels: Support: 22,100, 22,000, 21,900 Resistance: 22,200, 22,300, 22,400 (15-Minute Charts)
Positional Trading: Short-term Support: 21,850-21,200 Resistance: 22,500-23,000

BANK NIFTY
In the previous trading session, Bank Nifty concluded at 46,785.95, marking a gain of 185.75 points. Despite technical indicators signaling a negative trend, the index persists above its short-term moving averages. Furthermore, a white candle formation on the daily chart, coupled with a close above the previous day's level, suggests a positive bias. The closest intraday support is situated at 46,725, while resistance is noted at 46,950. A breach above 46,950 could sustain the positive trend for the day; otherwise, consolidation below this level might persist for a few days.
For intraday traders, support levels are identified at 46,725, 46,540, and 46,350, while resistance levels stand at 46,950, 47,200, and 47,400, as indicated by the 15-minute charts.
Positional traders are advised to monitor short-term support levels between 46,000 and 45,000, with resistance lying at 47,000 to 48,500.