
NIFTY TECHNICAL OUTLOOK
Based on Market Closing on Thursday, March 28, 2024
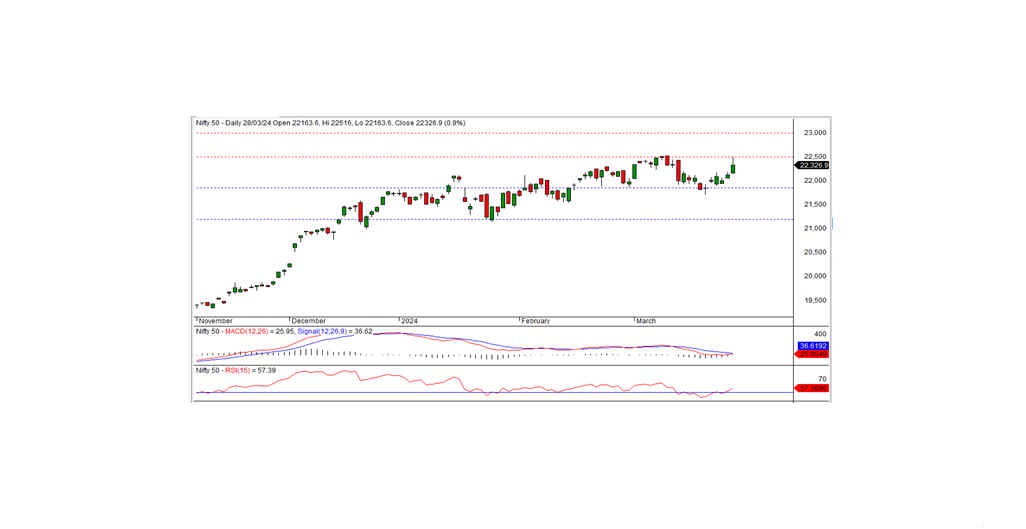
In the latest trading session, the Nifty concluded at 22326.90, marking an increase of 203.25 points or 0.92 percent. Positive momentum is expected to continue if the Nifty maintains levels above 22300.
The Nifty commenced the session positively at 22163.60 and sustained this momentum, reaching an intraday high of 22516 before settling at 22123.65 at closing. Except for the media sector, all other sectors closed with a positive bias. Leading sectoral gainers included PSU banks, automobiles, metals, and pharmaceuticals. The market breadth was negative, with 1188 stocks rising, 1241 falling, and 141 remaining unchanged. The top gainers under the nifty were BAJAJFINSV, GRASIM, HEROMOTOCO, and BAJFINANCE, while the major losers included SHRIRAMFIN, AXISBANK, RELIANCE, and TECHM.
From a technical perspective, the Nifty ended the session above both short-term and long-term moving averages, indicating a positive trend according to momentum indicators. Additionally, the index formed a white candle on the daily chart, closing higher than the previous day, suggesting a bullish bias. Notably, intraday support is observed at the 22300 level, and sustaining above this level could extend the positive trend in the upcoming days. The subsequent short-term resistance is anticipated at the 22500 level.
Intraday Levels: Support - 22300, 22200, 22100 Resistance - 22400, 22500, 22600 (15-Minute Charts)
Positional Trading: Short-term Support - 21850-21200 Resistance - 22500-23000.
BANK NIFTY
In the previous trading session, Bank Nifty closed at 47124.60, marking a gain of 338.65 points. Technically, momentum indicators signal a negative trend. However, the index maintains positions above both short-term and long-term moving averages. Furthermore, a white candle formation on the daily chart, along with a close above the previous resistance of 47000, suggests the potential continuation of the uptrend. The immediate intraday resistance is identified at 47200, and breaching this level could sustain the positive momentum for today.
For intraday traders, support levels are situated at 47000, 46800, and 46600, while resistance levels can be found at 47200, 47400, and 47600, as per the 15-minute charts.
Positional traders are advised to monitor short-term support levels between 47000-46000, with resistance anticipated at 48500-49500.
