NIFTY TECHNICAL ANALYSIS - January 30, 2024
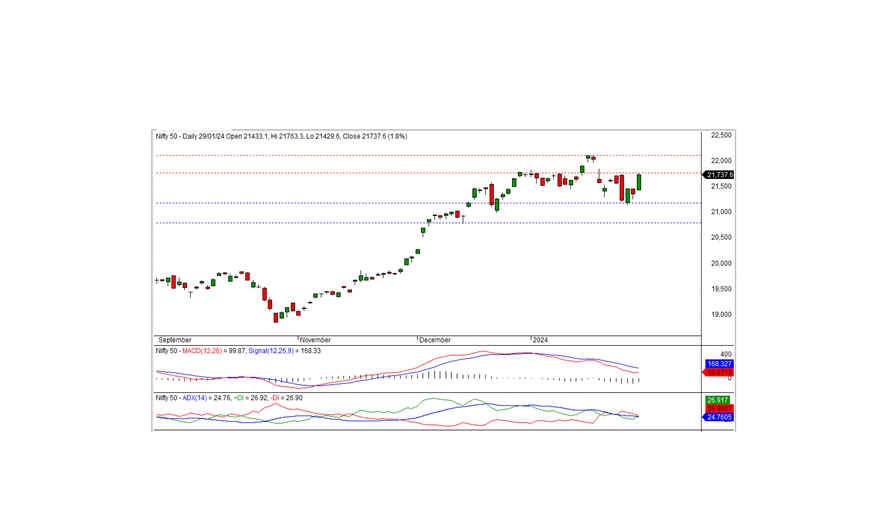
In the last trading session, Nifty closed at 21737.60, up 385 points or 1.80 percent. The positive momentum may continue if the Nifty breaches the 21750 resistance level.
Commencing at 21433.10, the Nifty opened on a positive note, sustaining a bullish trajectory throughout the trading session. Achieving an intraday peak of 21763.30, the index closed at 21737.60. Except FMCG and media sectors, all sectors concluded positively. The PSU banks, auto, metal, and financial services sectors were notable gainers. Market breadth favored the positive side, with 1356 stocks rising, 1047 falling, and 116 remaining unchanged. Leading the gainers under the Nifty were ONGC, RELIANCE, COAL INDIA, and ADANIENT, while CIPLA, ITC, LTIM, and INFY endured as the major losers.
Technically, the Nifty concluded above both short-term and long-term moving averages, with momentum indicators hinting at a positive trend. Notably, the index formed a long white candle on the daily chart, concluding near the day's high. Immediate short-term resistance is identified at 21750, If the index surpasses this level, the bullish trend can continue in the coming days as well. The nearest intraday support is positioned at 21650 levels.
Intraday Support Levels: 21650-21570-21475 Resistance Levels: 21750-21850-21950 (15 Minute Charts)
For positional traders, short-term support levels persist at 21500-21000, with resistance noted at 21750-22125.
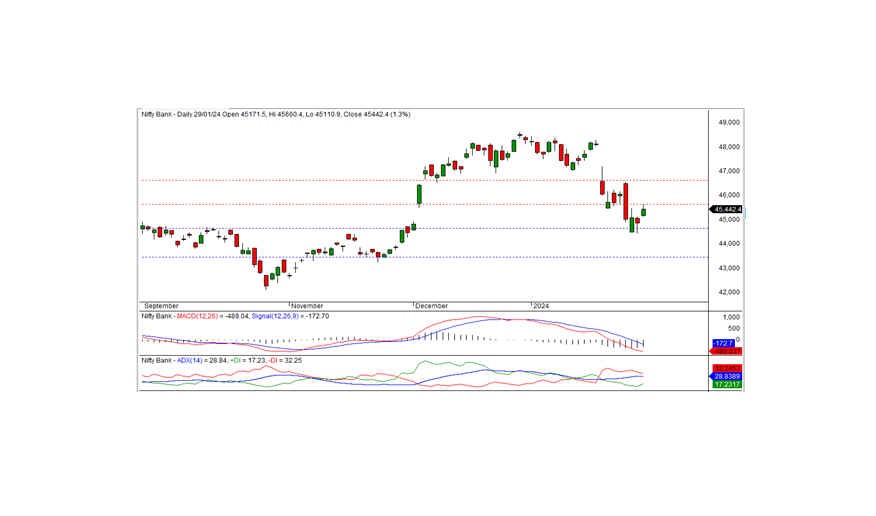
BANK NIFTY
In the previous trading session, Bank Nifty closed at 45442.35, marking a gain of 576.20 points. From a technical perspective, momentum indicators indicate a negative trend, with the index positioned below the medium-term moving averages. Nonetheless, the index formed a white candle on the daily chart, closing above the previous day's close, suggesting a potential consolidation phase.
Looking ahead, the index faces short-term resistance at the 46600 level. A close above this level may signal a further uptrend in the forthcoming days. Conversely, if the index fails to breach this level, the consolidation phase could persist for a few more days.
For intraday traders, support levels are identified at 45250, 45000, and 44650, while resistance levels can be observed at 45650, 46000, and 46250, as depicted by the 15-minute charts.
Positional traders are advised to monitor short-term support levels at 44600-43500, with resistance noted at 45600-46600.