. NIFTY Technical Analysis Report
Based on Market Closing on Thursday, March 21, 2024
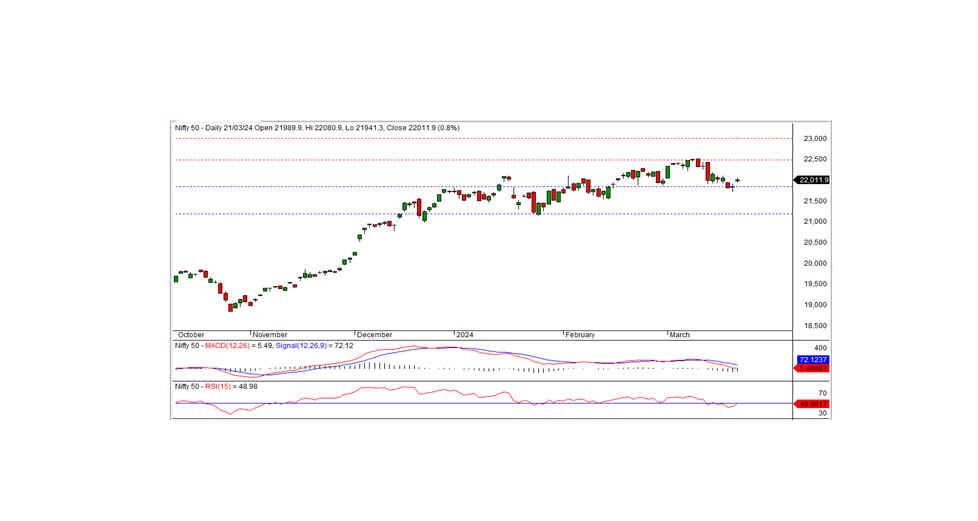
In the latest trading session, the Nifty closed at 22011.95, marking a gain of 172.85 points or 0.79 percent. Sustained positivity is anticipated if the Nifty maintains levels above 21950.
Opening at 21989.90, the Nifty started on a positive note and reached an intraday high of 22080.90. However, a subsequent decline saw it touching an intraday low of 21941.30 before closing at 22011.90. Notably, all sectors concluded positively, with realty, metal, PSU banks, and media leading the gains. Market breadth favored advances, with 1893 stocks rising, 533 falling, and 141 unchanged. Key gainers within the Nifty included BPCL, NTPC, POWERGRID, and TATASTEEL, while BHARTIARTL, HDFCLIFE, ONGC, and MARUTI witnessed declines.
From a technical viewpoint, the Nifty remains positioned below short-term moving averages, with momentum indicators signaling a negative trend. Despite this, the index displayed a small white candle on the daily chart, closing above the prior day's level, indicating a favorable bias. Intraday support is identified at the 21950 mark, with sustained trading above this level suggesting a continuation of the positive momentum. Short-term resistance is expected around 21500 levels.
Key Intraday Levels: Support - 22000, 21950, 21900 Resistance - 22080, 22150, 22200 (15-Minute Charts)
Positional Trading Analysis: Short-term Support - 21850-21200 Resistance - 22500-23000.
BANK NIFTY Technical Analysis
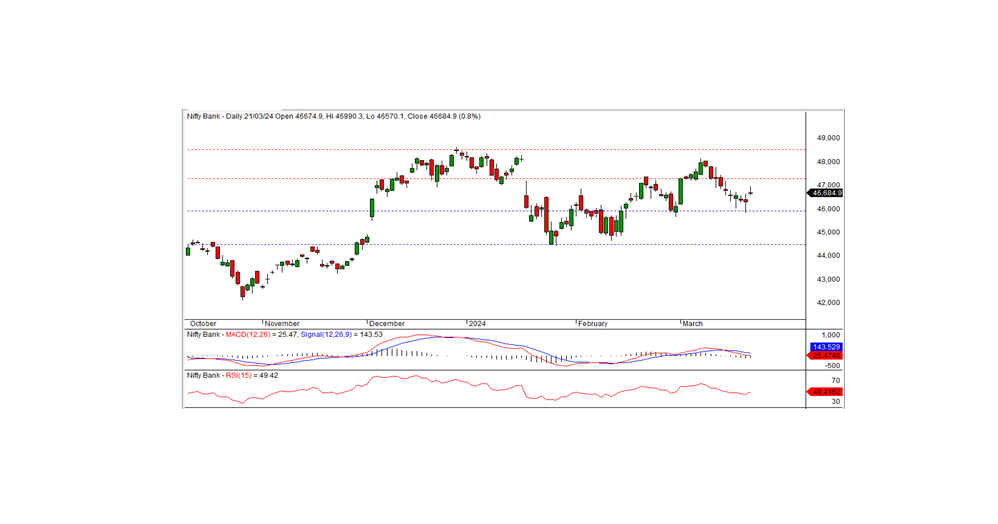
In the previous trading session, Bank Nifty closed at 46684.90, marking a gain of 374 points. Momentum indicators currently signal a negative trend, with the index positioned below short-term moving averages. However, the formation of a Doji candle on the daily chart, closing above the previous day's level, suggests a potential continuation of the uptrend.
Intraday support is observed near the 46600 level, while resistance is anticipated at 46800. A breach above 46800 could signify a further continuation of the uptrend.
For intraday traders, key support levels are identified at 46600, 46450, and 46200, while resistance levels can be monitored at 46800, 47000, and 47200, as indicated by the 15-minute charts.
Positional traders are advised to monitor short-term support levels around 46000-44500, with resistance identified at 47000-48500.
BANK NIFTY Technical Analysis
In the previous trading session, Bank Nifty closed at 46684.90, marking a gain of 374 points. Momentum indicators currently signal a negative trend, with the index positioned below short-term moving averages. However, the formation of a Doji candle on the daily chart, closing above the previous day's level, suggests a potential continuation of the uptrend.
Intraday support is observed near the 46600 level, while resistance is anticipated at 46800. A breach above 46800 could signify a further continuation of the uptrend.
For intraday traders, key support levels are identified at 46600, 46450, and 46200, while resistance levels can be monitored at 46800, 47000, and 47200, as indicated by the 15-minute charts.
Positional traders are advised to monitor short-term support levels around 46000-44500, with resistance identified at 47000-48500.