NIFTY TECHNICAL OUTLOOK
Based on Market Closing on Friday, November 24, 2023
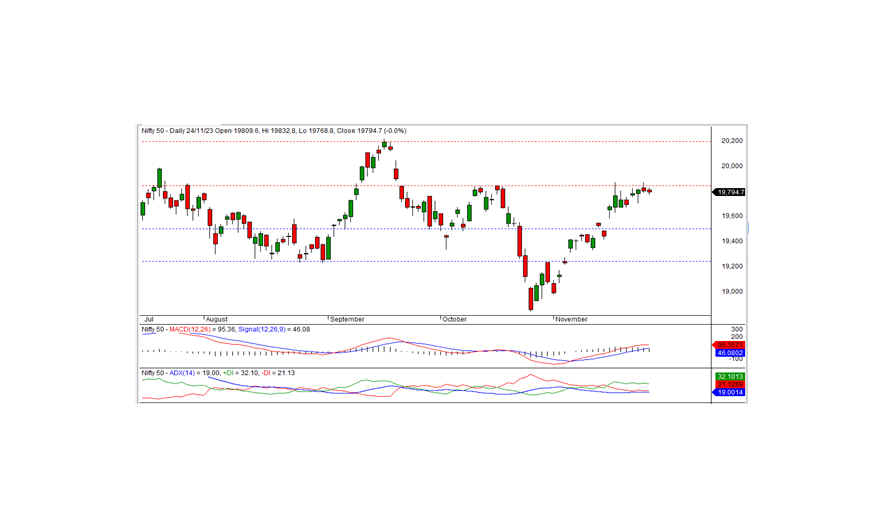
The Nifty concluded the trading session at 19794.70, experiencing a loss of -7.30 points or -0.04 percent. To establish a bullish trend, the Nifty needs to close above the 19850 level.
The day began positively as the Nifty opened at the 19809.60 level, reaching an intraday high of 19832.80 in the morning trade. However, the index faced a downturn, touching the intraday low of 19768.80 before closing at 19794.70. Noteworthy sector gainers included pharma, metal, bank, and financial services, while IT, FMCG, and PSU bank sectors closed on a negative bias. Market breadth was negative, with 1095 stocks rising, 1231 falling, and 154 remaining unchanged.
Top gainers under the Nifty were CIPLA, ADANIENT, DIVISLAB, and HINDALCO, whereas major losers included APOLLOHOSP, WIPRO, HCLTECH, and TCS.
Technical Analysis: From a technical standpoint, the Nifty remains above short-term and long-term moving averages, with momentum indicators signaling a positive trend. However, the daily chart shows a small black candle closing below the previous day's close, suggesting a potential consolidation. The Nifty faces short-term resistance at the 19850 level. A close above this level could resume bullish momentum, while failure may prolong the consolidation for a few more days. The nearest intraday support is at 19770 levels.
Intraday Levels (15-Minute Charts): Support Levels: 19770-19735-19700 Resistance Levels: 19830-19875-19925
For Positional Traders: Short-term support levels are observed at 19500-19233, with resistance at 19850-20200. Positional traders should monitor these levels for strategic decision-making.

BANK NIFTY
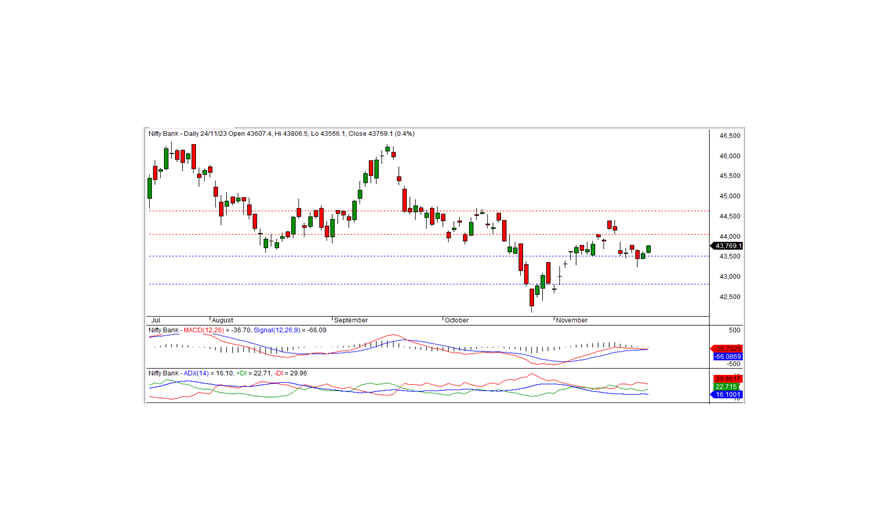
In the preceding trading session, Bank Nifty closed at 43769.10, marking a gain of 191.60 points. From a technical perspective, momentum indicators signal a positive trend, and the index closed above the short-term moving averages. Additionally, the formation of a white candle on the daily chart, closing above the day's high, suggests the potential for a further uptrend.
On the higher side, the index faces intraday resistance at 43800. If the index trades and sustains above this level, the positive trend may continue today. The nearest short-term support is identified at 43500 levels.
For Intraday Traders: Support Levels: 43650, 43500, 43350 Resistance Levels: 43800, 43950, 44100 (15-Minute Charts)
For Positional Traders: Positional traders are advised to monitor short-term support levels at 43500-42800, with resistance identified at 44000-44650. These levels can serve as strategic reference points for positional trading decisions.

