NIFTY TECHNICAL ANALYSIS
As of the market closing on Friday, December 08, 2023:
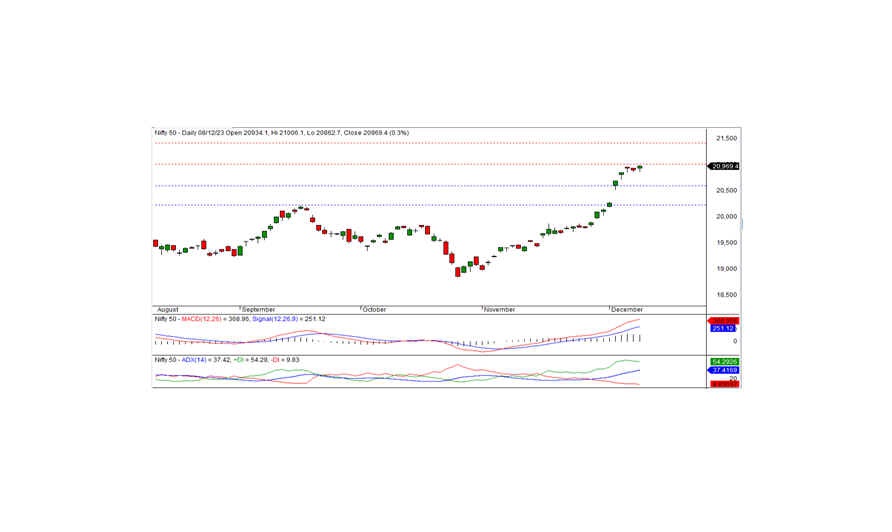
The Nifty concluded the trading session at a historic high of 20969.40, registering a gain of 68.25 points or 0.33 percent. To sustain the current bullish momentum, the index must surpass the crucial resistance level of 21000.
Opening at 20934.10 in a positive stance, the Nifty reached a record high of 21006.10 before experiencing a gradual decline, touching an intraday low of 20862.70. However, during the closing session, the index rebounded, ultimately closing at 20969.40. Notably, the IT, private bank, and financial services sectors emerged as the top gainers, while the FMCG, pharma, auto, and metal sectors ended on a negative note. The market breadth exhibited negativity, with 932 stocks rising, 1398 falling, and 153 remaining unchanged. Under the Nifty, notable gainers included HCLTECH, LTIM, JSWSTEEL, and APOLLO HOSP, whereas major losers comprised ADANIENT, ITC, ADANIPORTS, and HEROMOTOCO.
From a technical perspective, the Nifty maintains its position above both short-term and long-term moving averages, with momentum indicators signaling a robust positive trend. Additionally, the daily chart shows the formation of a white candle closing above the previous day's close, suggesting the potential for a further uptrend. On the upside, the index faces resistance at the 21000 level. A breakthrough beyond this point could sustain the bullish momentum in the upcoming days. Alternatively, the index might consolidate beneath this level for a brief period if it fails to surpass it.
Technical Levels: Intraday Support Levels: 20930-20850-20775 Resistance Levels: 21000-21075-21150 (15 Minute Charts)
For Positional Traders: Short-term support levels stand at 20600-20200, with resistance identified between 21000 and 21400.

BANK NIFTY
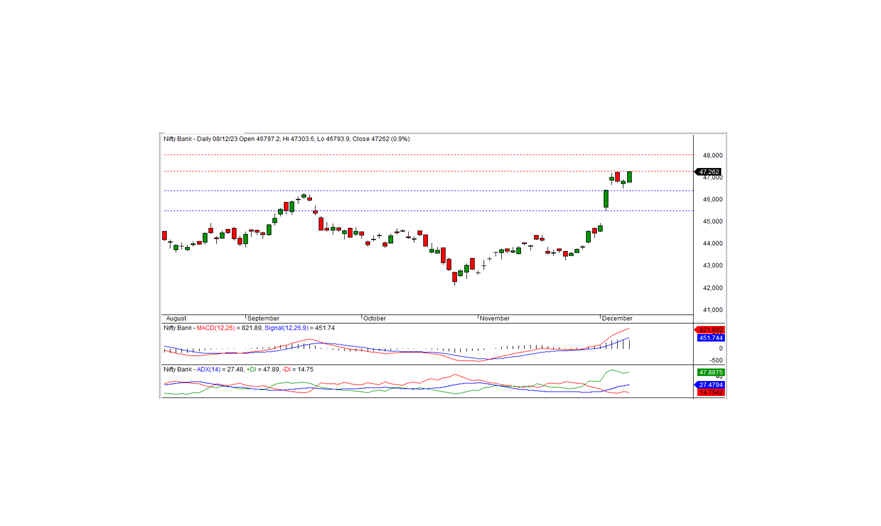
In the last trading session, Bank Nifty concluded at 47,262, marking an increase of 420.60 points. From a technical standpoint, momentum indicators suggest a positive trend, and the index maintains its position above both short-term and long-term moving averages. Furthermore, the daily chart reveals the formation of a white candle, closing above the prior day's close, indicating the potential for an extended uptrend. On the upper side, the index encounters short-term resistance at the 47,300 level. A breach above this level could extend the bullish trend in the upcoming days, with the subsequent short-term resistance noted at 48,000 levels.
For intraday traders, key support levels stand at 46,950, 46,700, and 46,500, while resistance levels are observed at 47,300, 47,550, and 47,800, as depicted by the 15-minute charts.
Positional traders are advised to monitor short-term support levels in the range of 46,400-45,500, with resistance identified between 47,300 and 48,000.

