Nifty Technical Outlook
Based on Market Closing on Monday, October 07, 2024
In the last trading session, the Nifty ended at 24,795.75, down by 218.85 points, or -0.87%. The downward bias is expected to continue if the index falls below the key intraday support level of 24,700.
Nifty opened positively at 25,084.10, testing an intraday high of 25,143.00 in the morning trade. However, the index lost momentum, falling sharply to an intraday low of 24,694.30 before closing at 24,795.75. Except for the IT sector, all others closed negatively. The media, banking, metal, and financial services sectors were the biggest laggards. Market breadth was weak, with 273 stocks advancing, 2,409 declining, and 58 remaining unchanged. Notable gainers included M&M, ITC, TRENT, and BHARTIARTL, while ADANI PORTS, BEL, NTPC, and COAL INDIA were among the top losers.
On the technical front, momentum indicators suggest a negative trend as the index remains below its short-term moving averages. Additionally, the Nifty formed a black candle on the daily chart, signaling a continuation of the bearish trend as it closed below the previous session’s low. Immediate support lies at the 24,700 level, and if the index breaks this, the downward trend is likely to extend. Conversely, resistance is placed at 24,850, which Nifty needs to surpass for any potential pullback rally.
From a short-term perspective, the index finds support in the 24,750-24,450 range. Momentum indicators are approaching the oversold zone, with the RSI closing at 38 on the daily chart. Historically, Nifty has rebounded from bearish trends when RSI values neared 33-35, hinting at a potential support zone around the 24,750-24,450 levels.
Intraday Levels: Support: 24,700, 24,575, 24,450 Resistance: 24,850, 25,000-25,125 (15-Minute Charts)
Positional Trading: Short-term support: 24,750-24,450 Resistance: 25,500-26,275
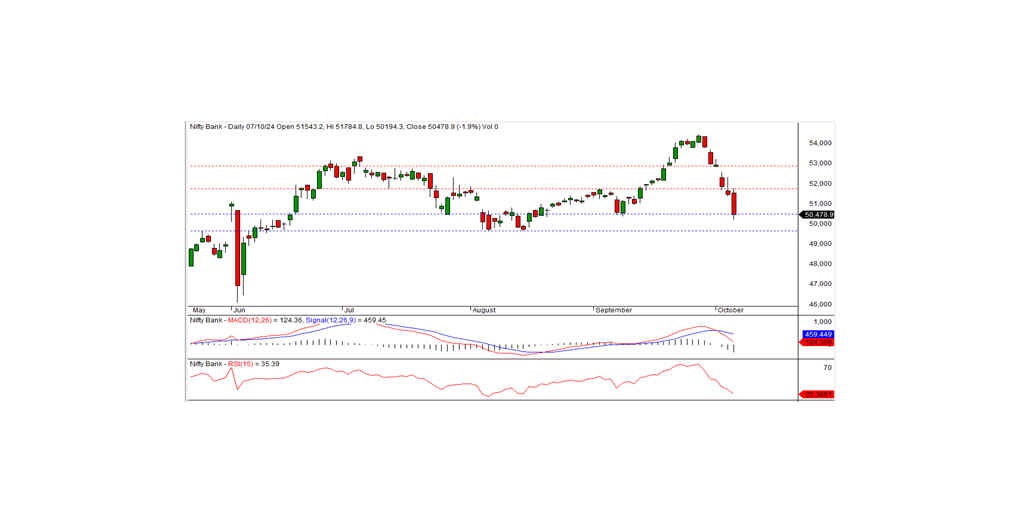
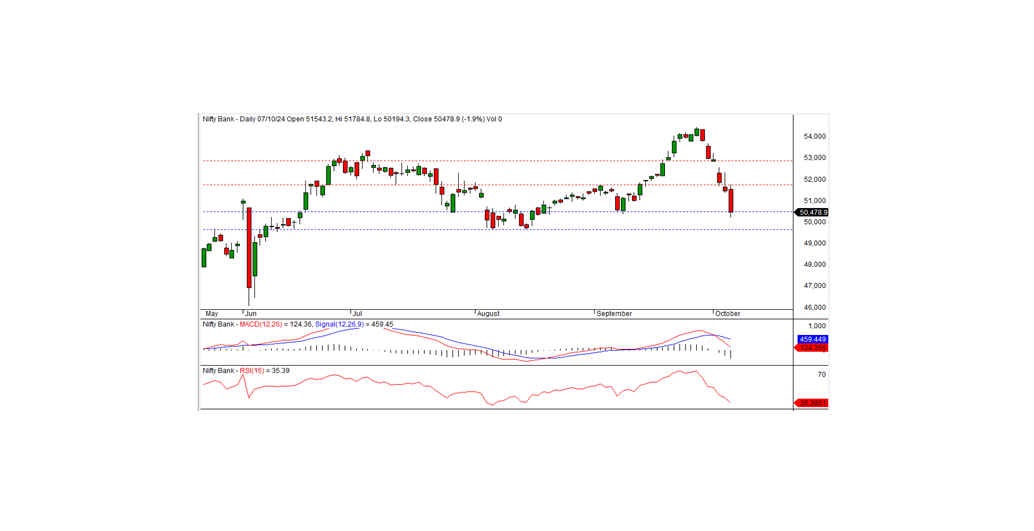
Bank Nifty Technical Outlook
In the previous trading session, Bank Nifty closed at 50,478.90, recording a significant loss of 983.15 points. Technically, momentum indicators are signaling a negative trend, with the index trading below its short-term moving averages. Additionally, the formation of a long black candle on the daily chart indicates a potential continuation of the downtrend, as the index closed just below the critical support level of 50,500. On the downside, Bank Nifty has immediate intraday support at 50,350.
Bank Nifty continues to face bearish pressure, with the index breaching key support levels and momentum indicators pointing to further weakness. A break below 50,350 could lead to additional downside in the near term. However, a sustained move above 50,850 may trigger a short-term recovery. Traders should closely monitor these levels for potential opportunities, keeping an eye on support and resistance for both intraday and positional strategies.
For intraday traders, key support levels are at 50,350, 50,000, and 49,650, while resistance levels are placed at 50,850, 51,200, and 51,550, as indicated by the 15-minute charts.
Positional Trading: Short-term support: 50,500–49,600 Resistance: 51,750–52,800