NIFTY TECHNICAL OUTLOOK
Based on Market Closing on Friday, October 11, 2024
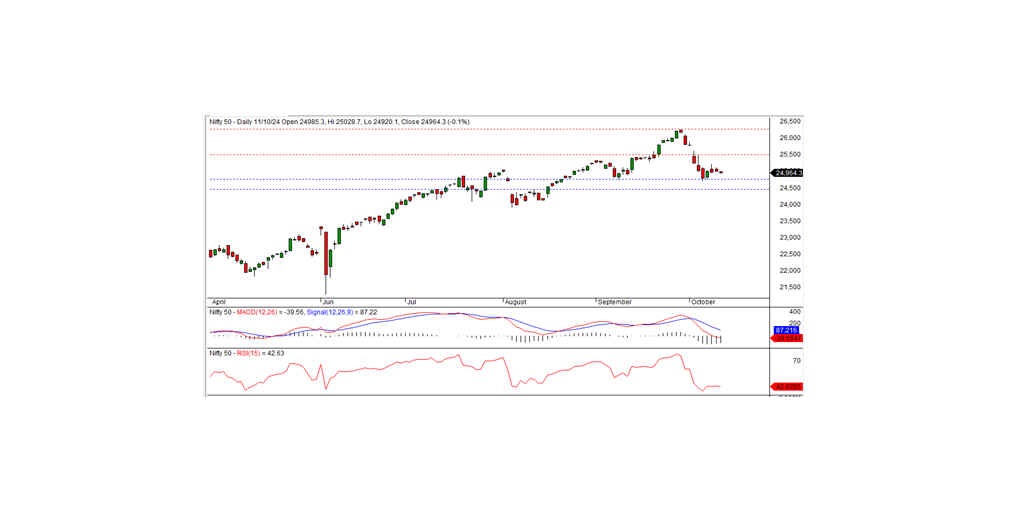
In the last trading session, the Nifty closed at 24,964.25, down by 34.20 points (-0.14%). The bearish momentum is likely to persist if the index continues to trade below the intraday support level of 24,925.
The session started with a negative opening at 24,985.30, followed by a brief upward move where the index tested an intraday high of 25,028.70 in the morning. However, Nifty gradually declined to hit an intraday low of 24,920.10 before closing at 24,964.25. Sector-wise, pharma, metal, media, and IT were the top gainers, while banks, realty, financial services, and auto underperformed. Market breadth was slightly negative, with 1,298 stocks advancing, 1,321 declining, and 123 remaining unchanged. TRENT, HINDALCO, HCLTECH, and TECHM emerged as the biggest gainers, while M&M, TCS, ICICIBANK, and CIPLA led the list of top losers.
From a technical perspective, momentum indicators continue to signal a bearish trend, as the index remains below its short-term moving averages. Additionally, Nifty formed a black candle on the daily chart, closing slightly below the previous day’s level, which indicates the potential for consolidation. On the downside, the intraday support is seen at 24,925, while resistance stands at 25,025. A break below 24,925 could signal further downside, whereas a move above 25,025 would be needed for a positive reversal.
Intraday Levels: Support: 24,925, 24,850, 24,765 Resistance: 25,025, 25,120-25,215 (15-Minute Charts)
Positional Trading Levels: Support: 24,750 - 24,450 Resistance: 25,500 - 26,275
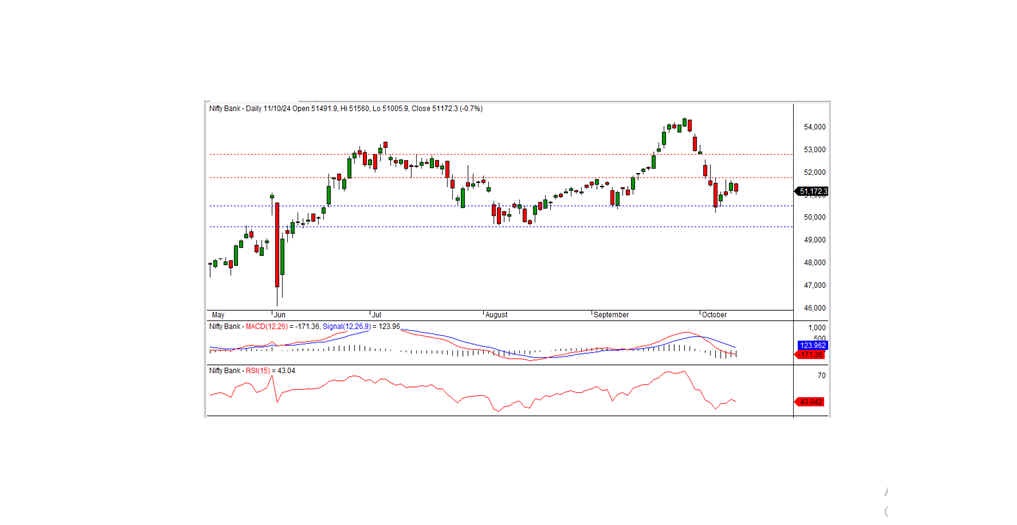
BANK NIFTY TECHNICAL OUTLOOK
In the previous trading session, Bank Nifty closed at 51,172.30, losing 358.60 points. From a technical perspective, momentum indicators continue to signal a negative trend, as the index remains below its short-term moving averages. Additionally, the formation of a black candle on the daily chart, coupled with a close below the prior day’s level, suggests a bearish bias.
On the downside, the index has intraday support at the 51,000 level, while resistance is at 51,200. The current technical outlook for Bank Nifty points to a bearish trend, especially if the index sustains below the 51,000 support level. A break below this level could further extend the downtrend. However, a move above 51,200 may trigger a pullback rally. Traders should be cautious, closely monitoring support and resistance levels to assess the next directional move.
According to the 15-minute charts, intraday traders should watch support levels at 51,000, 50,800, and 50,600, with resistance at 51,200, 51,400, and 51,600.
For positional traders, key support lies between 50,500 and 49,600, while resistance is expected between 51,750 and 52,800.