NIFTY TECHNICAL OUTLOOK
Based on Market Closing on Wednesday, June 05, 2024
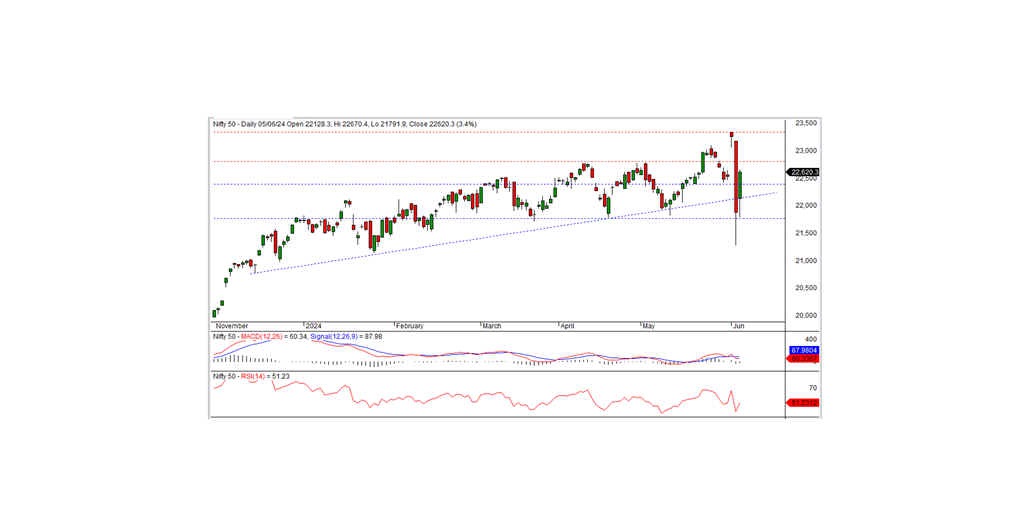
In the last trading session, the Nifty closed at 22,620.35, up 735.85 points or 3.36%. The uptrend is expected to continue if the index moves above the 22,670 level.
The Nifty opened at 22,128.30 with a positive bias, hit an intraday low of 21,791.90, then gradually rose to test the intraday high of 22,670.40, and finally closed at 22,620.35. All sectors closed on a positive note, with metals, banks, auto, and FMCG being the biggest gainers. The market breadth was positive, with 1,862 stocks rising, 653 falling, and 96 remaining unchanged. All stocks under Nifty closed on a positive bias, with ADANI PORTS, INDUSINDBK, HINDALCO, and HEROMOTOCO being the top gainers.
From a technical standpoint, momentum indicators signal a negative trend. However, the Nifty remains above its long-term and medium-term moving averages. In the last session, the index formed a long white candle on the daily chart, closing within the previous day's candle. This pattern resembles a bullish harami pattern, which indicates a potential reversal of the bearish trend. For confirmation, the index should trade and sustain above the harami pattern high. On the higher side, 22,670 levels act as the nearest intraday resistance. Positive trends are likely to continue today if the index rises above this level. The nearest intraday support remains at 22,425.
Intraday Levels: Support: 22,425, 22,150, 21,850 Resistance: 22,670, 22,835-23,605 (15-Minute Charts)
Positional Trading: Short-term support: 22,400-21,750 Resistance: 22,800-23,340
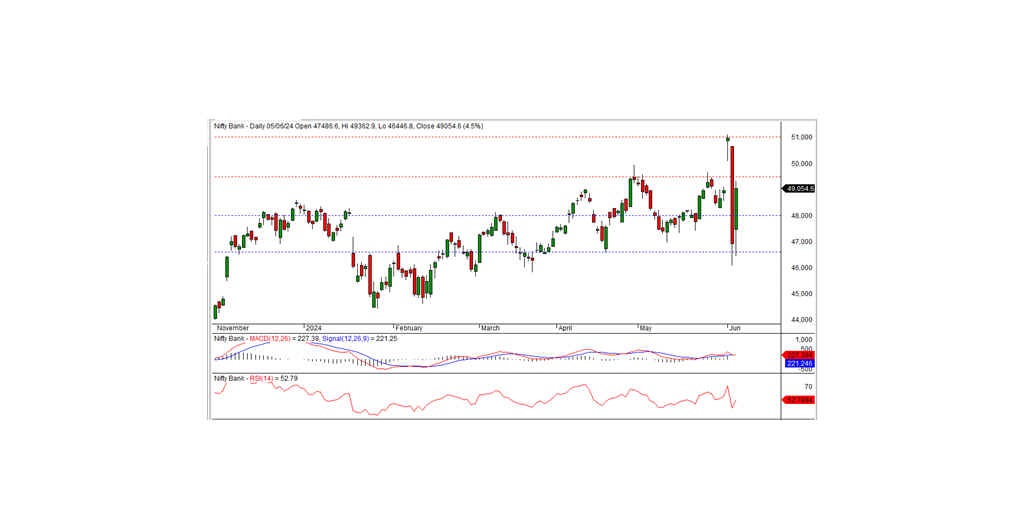
BANK NIFTY
In the preceding trading session, Bank Nifty closed at 49,054.60, registering a gain of 2,126 points. Technically, momentum indicators signal a positive trend, and the index closed above its medium-term and short-term moving averages. Additionally, the index formed a long white candle on the daily chart and closed within the previous day's candle, indicating a slowdown in the bearish trend and the possibility of further upward movement.
On the higher side, 49,500 levels act as the nearest intraday resistance for the index. If the index surpasses this level, the positive trend will likely continue today. Otherwise, the index may consolidate below this level for a few days. The nearest intraday support is at 48,650 levels.
Intraday Levels: Support: 48,650, 48,000, 47,400 Resistance: 49,500, 50,000, 50,670 (15-Minute Charts)
Positional Trading: Short-term support: 48,000-46,600 Resistance: 49,500-51,000