NIFTY TECHNICAL OUTLOOK
Based on Market Closing on Tuesday, December 12, 2023
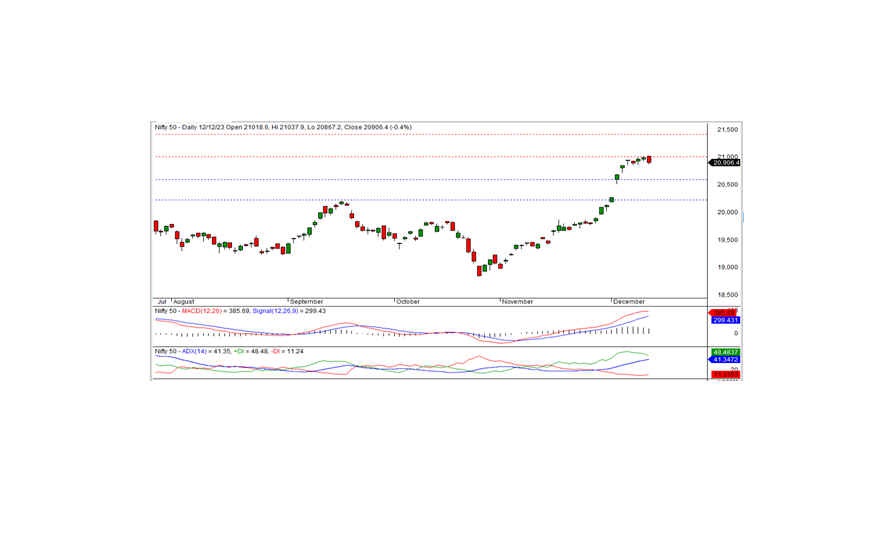
The Nifty concluded the trading session at 20906.40, marking a loss of -90.70 points or -0.43 percent. To sustain the bullish trend, the Nifty needs to close above 21000; otherwise, profit booking can be anticipated near the resistance level.
Opening at 21018.60 on a positive note, the Nifty reached an all-time high of 21037.90. However, the index failed to maintain momentum, experiencing a dip to the intraday low of 20867.20 before closing at 20906.40. Except for media, metal, and PSU bank sectors, all others closed negatively, with realty, auto, private bank, and IT witnessing the most significant losses. The market breadth leaned towards the negative side, with 946 stocks rising, 1406 falling, and 132 remaining unchanged. Top gainers under the Nifty were HDFCLIFE, ULTRACEMCO, BAJAJ-AUTO, and SBILIFE, while major losers included BPCL, APOLLO HOSP, MARUTI, and SUN PHARMA.
From a technical perspective, the Nifty remains above short-term and long-term moving averages, with momentum indicators signaling a positive trend. However, a black candle was formed on the daily chart, closing below the previous day's close, and it looks like a bearish engulfing pattern. This pattern hints at a potential slowdown in the recent uptrend and the likelihood of a trend reversal. For confirmation, the index needs to trade and sustain below the bearish engulfing pattern in the coming days. On the upside, the index faces resistance at 21000 levels. Closing above this level could reignite bullish momentum; otherwise, profit booking is anticipated near the resistance.
Intraday Levels (15-Minute Charts): Support Levels: 20860-20800-20730 Resistance Levels: 20950-21050-21125
For Positional Traders: Short-Term Support Levels: 20600-20200 Short-Term Resistance Levels: 21000-21400

BANK NIFTY
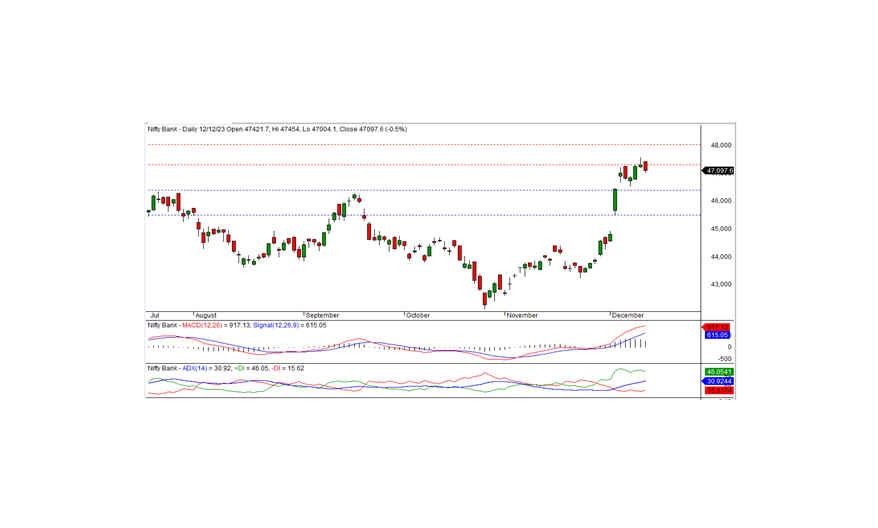
In the previous trading session, Bank Nifty closed at 47097.55, marking a loss of -216.70 points. From a technical standpoint, momentum indicators signal a positive trend, and the index remains positioned above both short-term and long-term moving averages. However, a black candle formation on the daily chart, closing below the previous short-term support of 47,300, suggests a potential shift in sentiment. If the index trades and sustains below this level, a continuation of the downtrend in the coming days is possible, with the next short-term support identified at 46400.
For intraday traders, support levels are situated at 46900, 46650, and 46400, while resistance levels are observed at 47200, 47400, and 47600, as indicated by the 15-minute charts.
Positional traders are advised to monitor short-term support levels at 46400-45500, with resistance levels identified at 47300-48000. Keeping a close eye on these levels will provide insights into potential market movements.

