NIFTY TECHNICAL OUTLOOK
Based on Market Closing on Tuesday, February 27, 2024
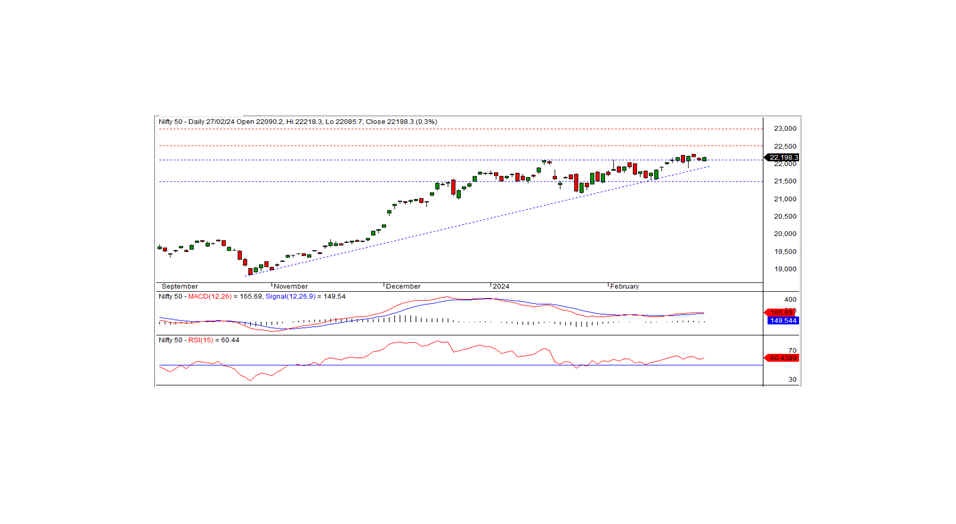
In the recent trading session, the Nifty concluded at 22198.35, marking a gain of 76.30 points or 0.34 percent. The upward momentum may persist if the Nifty holds above the 22175 mark.
The Nifty began the session on a pessimistic note at 22090.20, reaching an intraday low of 22085.70 in the morning session. However, it steadily climbed reaching an intraday peak of 22218.30 before settling at 22198.35. Among sectors, realty, IT, auto, and pharma were the biggest gainers, while media, PSU banks, financial services, and FMCG faced downward pressure. Market breadth favored decliners, with 825 stocks advancing, 1619 declining, and 102 remaining unchanged. Notable gainers under the Nifty included TATAMOTORS, TCS, INDUSINDBK, and SUN PHARMA, whereas HEROMOTOCO, BAJFINANCE, SBIN, and DIVISLAB experienced significant losses.
Technically, the Nifty remains positioned above both short-term and long-term moving averages, with momentum indicators signaling a positive trend. Additionally, the index formed a white candle on the daily chart, closing near the day's high, indicating a favorable bias. The index needs to stay above intraday support at 22175 to maintain bullish momentum. On the upside, the Nifty faces intraday resistance at 22250 levels.
Intraday Levels: Support: 22175-22100-22025 Resistance: 22250-22300-22350 (Based on 15-Minute Charts)
For positional traders, short-term support levels are identified at 22125-21500, with resistance seen at 22500-23000.
BANK NIFTY
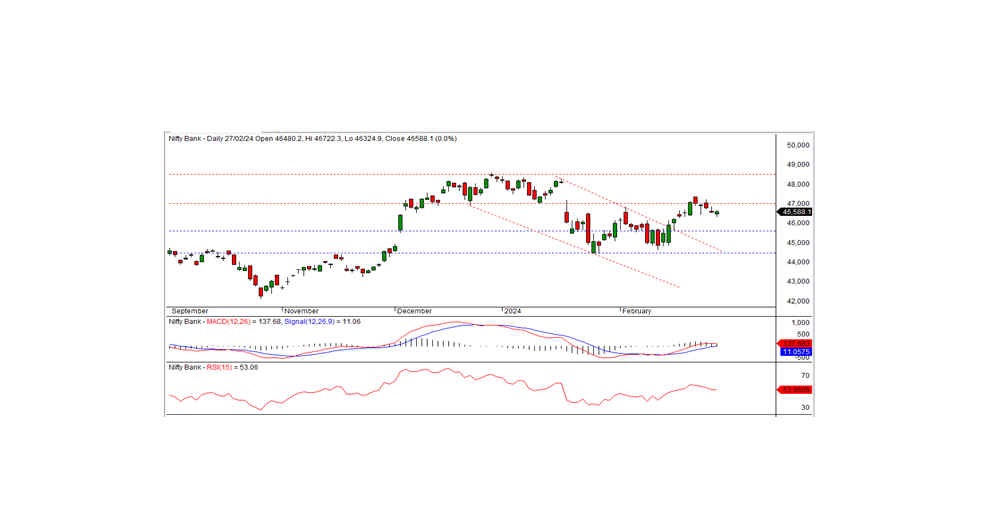
In the previous trading session, Bank Nifty concluded at 46588.05, marking a modest gain of 11.55 points. From a technical perspective, momentum indicators signify a positive trend, with the index positioned above both short-term and long-term moving averages. The formation of a small white candle on the daily chart, closing marginally above the previous day's close, suggests a favorable bias. Intraday support for the index stands at 46500; sustaining above this level could uphold the positive momentum. Conversely, short-term resistance is observed at 46800.
For intraday traders, support levels are noted at 46500, 46300, and 46100, while resistance levels are delineated at 46800, 47000, and 47200 based on 15-minute charts.
Positional traders are advised to monitor short-term support levels at 45600-44500, with resistance identified at 47000-48500.