NIFTY TECHNICAL OUTLOOK
Based on the Market Closing on Monday, March 04, 2024
In the previous trading session, the Nifty closed at 22405.60, marking a gain of 27.20 points or 0.12 percent. The positive momentum may persist if the Nifty maintains trading above the 22360 level.
Opening at 22403.50, the Nifty commenced positively and reached an intraday high of 22440.90 during morning trade. Afterward, the index traded sideways and finally settled at 22405.60. Notable gainers encompassed the banking, financial services, pharmaceutical, and realty sectors, whereas the media, IT, auto, and FMCG sectors experienced declines. Market breadth favored declines, with 829 stocks rising, 1609 falling, and 111 remaining unchanged. Top gainers beneath the Nifty included NTPC, HDFCLIFE, POWERGRID, and ONGC, while notable losers comprised EICHERMOT, JSWSTEEL, M&M, and SBILIFE.
Technically, the Nifty remains positioned above both short-term and long-term moving averages, with momentum indicators signaling a positive trend. The formation of a Doji candle on the daily chart, closing above the preceding day's level, suggests a favorable bias. Immediate intraday support lies at 22360 levels, with sustained trading above expected to support a positive trend. On the upside, intraday resistance is expected at 22440 levels.
Intraday Levels: Support: 22360-22280-22200 Resistance: 22430-22500-22570 (15 Minute Charts)
Positional Levels for Traders: Short-term Support: 22300-21835 Resistance: 22750-23250

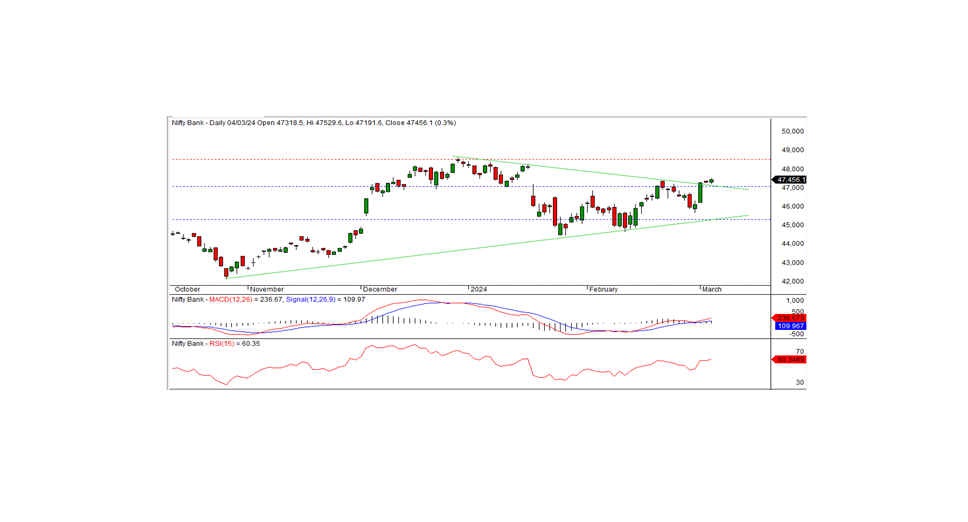
BANK NIFTY
In the previous trading session, Bank Nifty concluded at 47456.10, marking a gain of 158.60 points. Technically, momentum indicators signal a positive trend, with the index positioned above both short-term and long-term moving averages. Additionally, a white candle formation on the daily chart, closing above the previous day's level, underscores a positive bias. In terms of intraday dynamics, the index finds support at 47200, while resistance resides at 47500. A breach above the 47500 level could sustain the positive trend in the forthcoming sessions; however, failure to do so might lead to consolidation below this level for a few days.
For intraday traders, support levels stand at 47200, 46900, and 46650, whereas resistance levels are identifiable at 47500, 47750, and 48000, as per the 15-minute charts.
Positional traders are advised to monitor short-term support levels at 47000-45300, with resistance anticipated at 48000.