NIFTY TECHNICAL UPDATE - DECEMBER 07, 2023
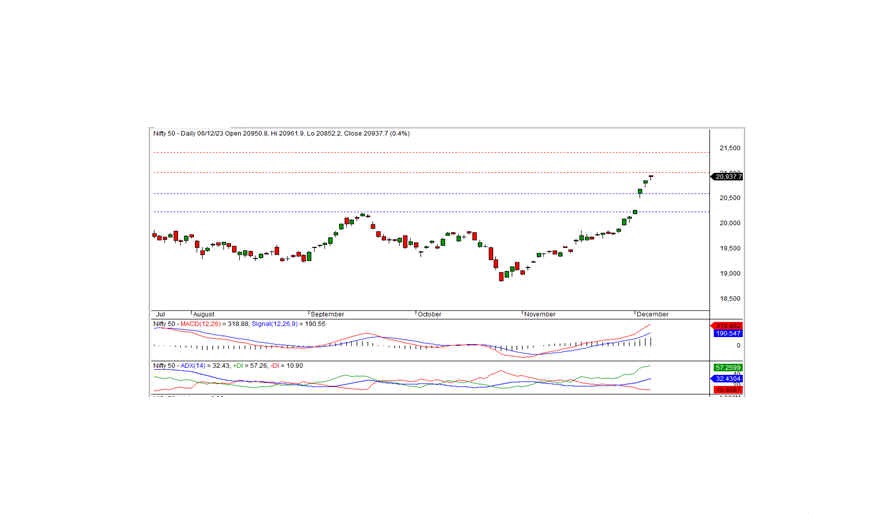
The market concluded on Wednesday, December 06, 2023, with the Nifty reaching a historic high, closing the session at 20937.70. This marked a significant gain of 82.60 points or 0.40 percent. It is crucial to sustain above the key level of 20862 to uphold the present bullish momentum.
Commencing the day at 20950.80 with a positive bias, the Nifty reached its all-time high at 20961.90 before settling at 20937.70. Key sector gainers included media, IT, FMCG, and PSU banks, while Nifty bank, pharma, private banks, and realty witnessed notable losses. Market breadth remained positive, with 1218 stocks advancing, 1129 declining, and 134 unchanged. Noteworthy gainers beneath the Nifty umbrella were WIPRO, LTIM, ITC, and LT, while ADANIENT, EICHERMOT, CIPLA, and NTPC faced significant losses.
From a technical perspective, the Nifty continues to hold above both short-term and long-term moving averages, with momentum indicators signaling a robust positive trend. Despite forming a small black candle on the daily chart, the index closed at an all-time high, suggesting the potential for further upward movement. Resistance for the index is identified at 20962-21000 levels. A breach beyond this level could sustain the bullish momentum in the ensuing days; otherwise, the index may consolidate below this threshold for a brief period.
Intraday support levels are marked at 20850-20735-20640, with resistance levels at 20962-21060-21150, as indicated by the 15-minute charts.
For positional traders, short-term support levels are defined at 20600-20200, accompanied by resistance levels at 21000-21400. Monitoring these levels will be crucial for strategic decision-making in the upcoming trading sessions.

BANK NIFTY UPDATE
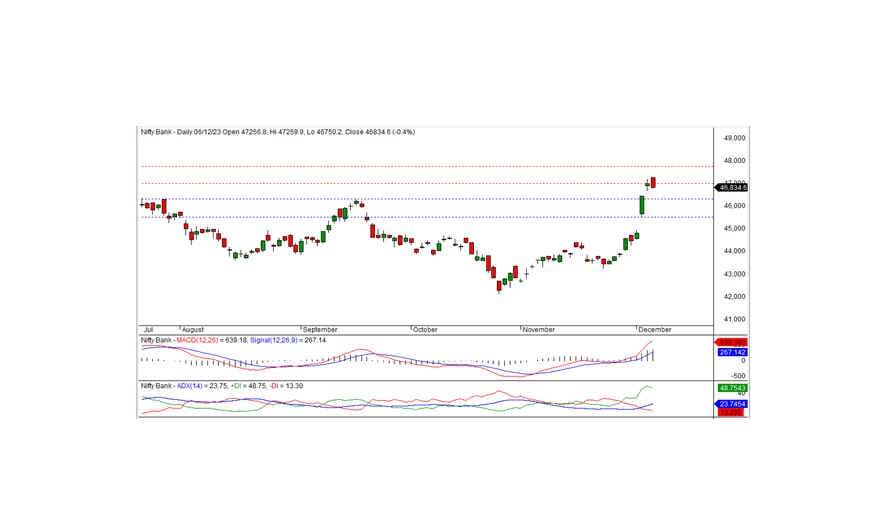
In the most recent trading session, Bank Nifty concluded at 46834.55, marking a loss of 177.70 points. From a technical standpoint, momentum indicators continue to signal a positive trend, and the index maintains its position above both short-term and long-term moving averages. However, it is noteworthy that the index formed a black candle on the daily chart and closed below the previous day's close, indicating a slightly negative bias.
On the downside, intraday support is identified at 46740 levels. A breach below this level could potentially extend the ongoing downtrend. Conversely, a rebound rally may be anticipated if the index holds above this support area.
For intraday traders, key support levels are situated at 46740, 46500, and 46200, while resistance levels can be observed at 47175, 47500, and 47800, as depicted on the 15-minute charts.
Positional traders are advised to monitor short-term support levels at 46300-45500, with resistance levels notable at 47000-47750. These levels will be crucial for strategic decision-making and trend assessment in the upcoming trading sessions.

