
NIFTY TECHNICAL ANALYSIS
Based on Market Closing on Tuesday, March 26, 2024
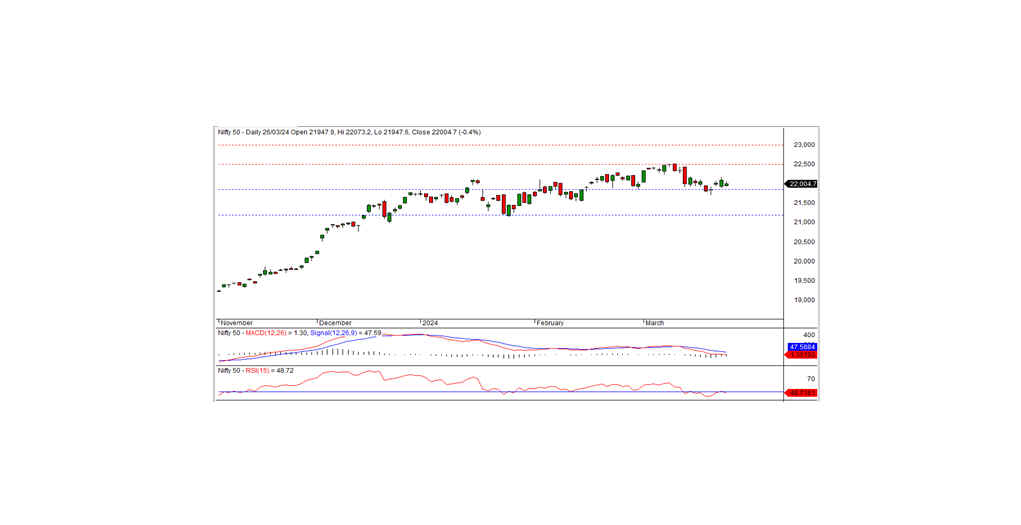
In the previous trading session, the Nifty concluded at 22004.70, marking a decline of 92.05 points or 0.42 percent. The downward trajectory is likely to persist should the Nifty breach the 22000 threshold.
During the last trading session, the Nifty commenced at 21947.90, displaying a negative trend. However, the index rebounded after that, reaching an intraday high of 22073.20 before settling at 22004.70. Sectors such as realty, metal, and PSU banks ended positively, whereas media, IT, banks, and financial services witnessed notable losses. The market breadth skewed negative, with 845 stocks advancing, 1615 declining, and 110 remaining unchanged. Noteworthy gainers within the Nifty included BAJFINANCE, HINDALCO, BRITANNIA, and ADANIPORTS, while notable losers encompassed POWERGRID, EICHERMOT, BHARTIARTL, and WIPRO.
Technically, the Nifty maintains its position above the five-day moving average, although momentum indicators indicate a bearish trend. A white candle formation on the daily chart, and a close below the previous day's level, suggests a negative bias. In terms of support, the index finds intraday support at the 22000 mark. Sustained trade below this level could extend the downtrend in subsequent sessions, whereas staying above this support may trigger a corrective rally.
Intraday Levels: Support - 22000, 21915, 21850 Resistance - 22070, 22150, 22225 (15-Minute Charts)
Positional Trading: Short-term support - 21850-21200 Resistance - 22500- 23000.
BANK NIFTY OUTLOOK
In the previous trading session, Bank Nifty concluded at 46600.20, marking a decline of 263.55 points. From a technical perspective, momentum indicators indicate a bearish trend, although the index remains positioned above short-term moving averages. Notably, a Doji candle formation occurred on the daily chart, accompanied by a close below the previous day's level, signaling a negative bias. In terms of immediate levels, the nearest intraday support lies at 46540, with resistance at 46800. A breach below 46540 could extend the ongoing downtrend, while a rebound from this level may instigate a pullback rally. For intraday traders, support levels are identified at 46540, 46400, and 46200, while resistance levels stand at 46800, 47000, and 47200, as depicted by the 15-minute charts. Positional traders are advised to monitor short-term support levels at 46000-44500, with resistance at 47000-48500.
