NIFTY TECHNICAL OUTLOOK
Based on Market Closing on Thursday, April 4, 2024
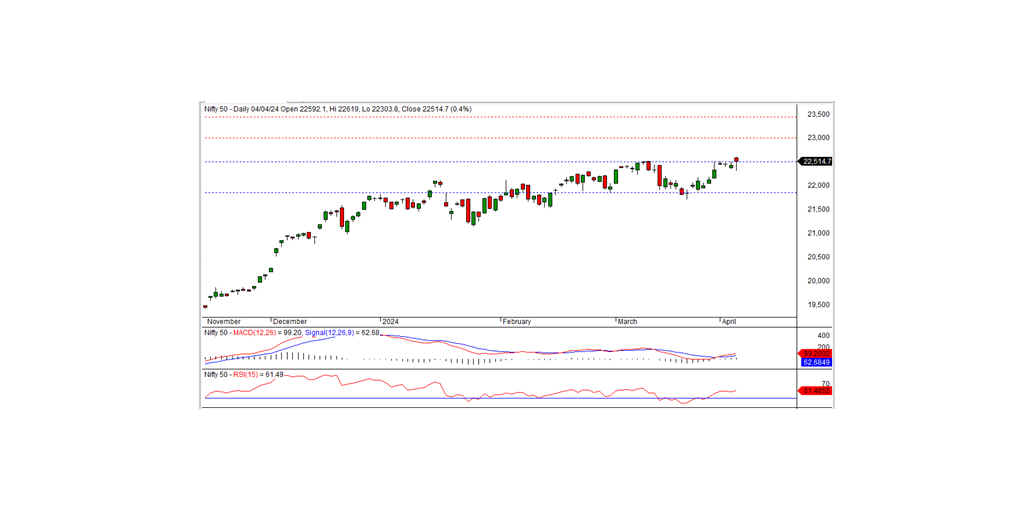
In the most recent trading session, the Nifty concluded at 22514.65, marking a gain of 80.00 points or 0.36 percent. Sustained positive momentum is anticipated if the Nifty remains above the critical 22500 level.
During the trading session, the Nifty commenced at the 22592.10 level with a positive sentiment, scaling to a record high of 22619.00. Subsequently, the index experienced a sharp decline, reaching an intraday low of 22303.80. However, it staged a significant rebound in afternoon trade, ultimately closing at 22514.65. The private bank, IT, nifty bank, and financial services were the biggest sector gainers, while the major losers were PSU banks, FMCG, pharma, and media. The market breadth favored gains, with 1463 stocks advancing, 962 declining, and 154 remaining unchanged. Notable gainers within the Nifty included HDFCBANK, EICHERMOT, TECHM, and TITAN, while prominent losers encompassed ONGC, SHRIRAMFIN, ADANIPORTS, and BPCL.
From a technical perspective, the Nifty remains positioned above both short-term and long-term moving averages, with momentum indicators signaling a positive trend. A black candle was formed on the daily chart, closing above the previous resistance of 22500. The long lower shadow of the candle indicates robust buying support near the support zone, further affirming bullish momentum. If the nifty remains above the 22500 level, a positive trend can also be expected in the coming days. The next short-term resistance is at 23000.
Intraday Levels: Support - 22500, 22400, 22300 Resistance - 22600, 22700, 22800 (Based on 15-Minute Charts)
Positional Trading: Short-term Support - 22500-21850 Resistance - 23000-23500.

BANK NIFTY
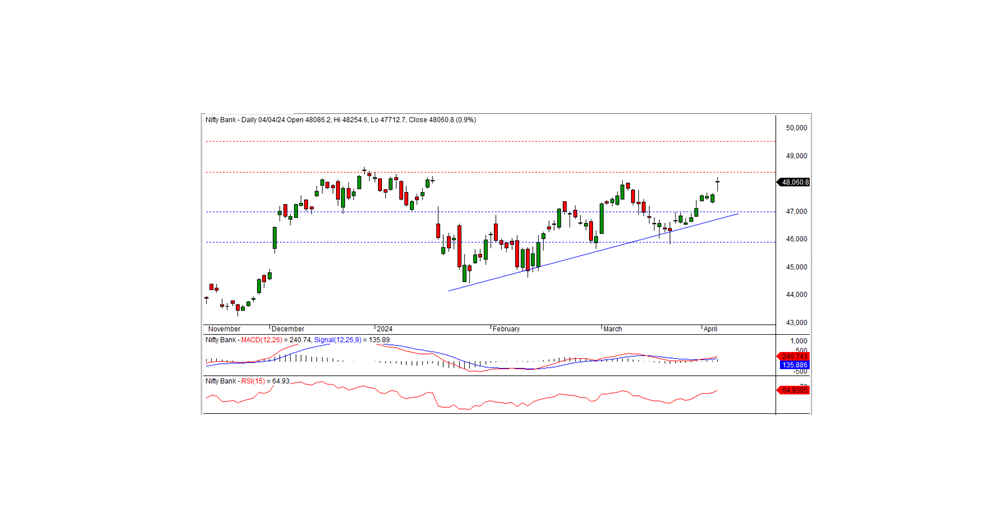
In the previous trading session, Bank Nifty concluded at 48060.80, marking a gain of 436.55 points. Technically, momentum indicators are signaling a positive trend, with the index maintaining levels above both short-term and long-term moving averages. A Doji candle formed on the daily chart, closing above the previous day's close, suggesting a potential continuation of the uptrend. The nearest intraday resistance is noted at 48250, while support remains at 48050. Further upward movement may be anticipated if the index breaches the 48250 level.
For intraday traders, support levels are identified at 48050, 47850, and 47650, while resistance levels can be observed at 48250, 48450, and 48650, as depicted by the 15-minute charts.
Positional traders should focus on short-term support levels within the range of 47000-46000, with resistance anticipated at 48500-49500.

