NIFTY TECHNICAL OUTLOOK
Based on the market close on Friday, March 01, 2024
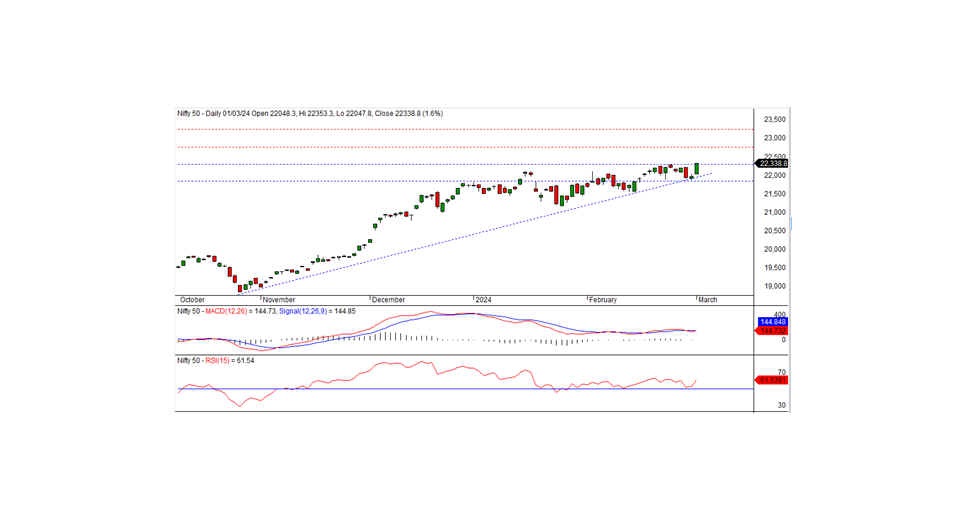
In the last trading session, the Nifty closed at a record high of 22338.75, up 355.95 points or 1.62 percent. The positive trend can continue today if the nifty trades and sustains above the 22300 level.
During the latest trading session, the NIFTY commenced at 22048.30 on a positive note, sustaining its upward momentum throughout the session and testing a record high of 22353.30 before settling at 22338.75. Notably, all sectors except media, pharma, and IT exhibited a positive bias, with metals, banks, auto, and financial services emerging as the top gainers. Market breadth remained positive, with 1508 stocks rising, 946 falling, and 95 remaining unchanged. Leading gainers under the NIFTY include TATASTEEL, JSWSTEEL, LT, and TITAN, while prominent losers comprised DRREDDY, HCLTECH, SUN PHARMA, and INFY.
From a technical standpoint, the NIFTY continues to hover above both short-term and long-term moving averages, with momentum indicators signaling a bullish trend. Additionally, the index formed a long white candle on the daily chart, closing near the record high, suggesting the potential continuation of the upward trajectory. The nearest intraday support is at 22300 levels. If the index trades and sustains above this level the positive trend can continue today also. On the higher side, the next short-term resistance is at 22750.
Intraday Support levels -22300-22200-22100 Resistance levels –22375-22450-22525(15 Minute Charts)
Positional traders' short-term support levels remain at 22300-21850, with resistance at 22750-23250.
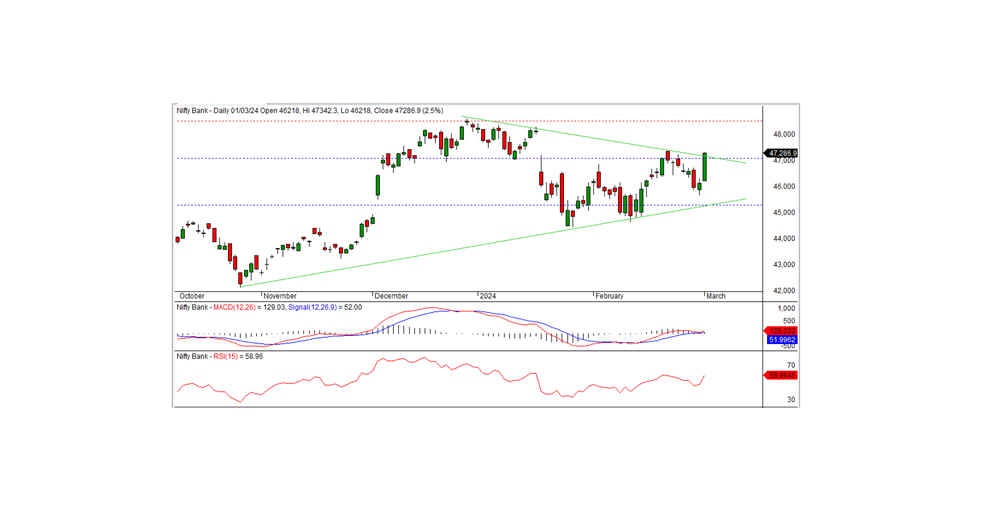
BANK NIFTY In the previous trading session, Bank Nifty concluded at 47286.90, marking a substantial gain of 1166.00 points. Technically, momentum indicators continue to signal a positive trend, with the index positioned above both short-term and long-term moving averages. Notably, the index formed a long white candle on the daily chart, breaching the resistance at 47000. Sustained levels above this mark could extend the positive trajectory in the forthcoming sessions, with the next short-term resistance noted at 48500.
For intraday traders, support levels are identified at 47000, 46700, and 46400, while resistance levels can be observed at 47300, 47600, and 47900, as indicated by the 15-minute charts.
Positional traders are advised to monitor short-term support levels situated at 47000-45300, with resistance marked at 48500.