NIFTY TECHNICAL ANALYSIS
Based on Market Closing on Monday, May 13, 2024
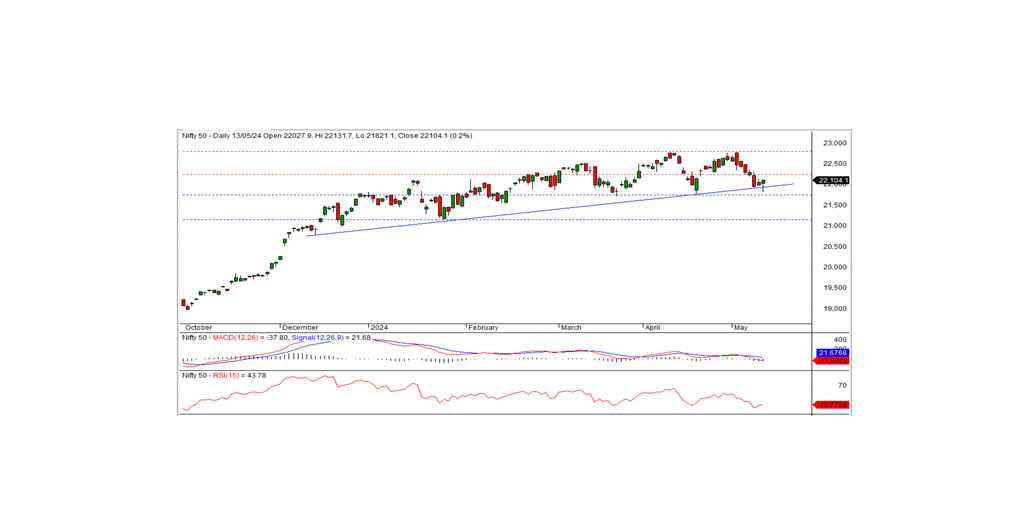
In the latest trading session, the Nifty closed at 22,104.05, marking a modest gain of 48.85 points or 0.22 percent. The positive momentum is poised to persist if the Nifty breaches the intraday resistance at the 22,130 level.
Opening at 22,027.90, the Nifty initially faced a downtrend, hitting an intraday low of 21,821.10 during morning trading. However, the index gradually recovered, reaching an intraday high of 22,131.70 before settling at 22,104.05. Notable sectoral gainers included pharmaceuticals, metals, real estate, and private banks, while automotive, PSU banks and media sectors experienced losses. Market breadth skewed negative, with 1,089 stocks advancing, 1,388 declining, and 127 unchanged. Key gainers within the Nifty were CIPLA, ASIAN PAINT, ADANI PORTS, and DIVISLAB, whereas major losers encompassed TATAMOTORS, BPCL, SHRIRAMFIN, and NTPC.
From a technical perspective, the Nifty remains positioned below short-term moving averages, and momentum indicators reflect a negative trend. However, the index formed a white candle on the daily chart, closing above the prior session's bullish Harami pattern, and it looks like a Hammer candlestick pattern. This pattern implies a strong bullish sentiment, as indicated by the long lower shadow of the Hammer, suggesting a test of support levels followed by a rebound. Nonetheless, it's crucial to recognize that this pattern doesn't conclusively signal complete control by bulls; rather, it suggests an uptick in bullish momentum.
Regarding levels, intraday support for the Nifty stands at 22,000, with resistance at 22,130. A breakthrough above the resistance level of 22,130 is imperative for sustaining a positive trend.
Intraday Levels: Support: 22,000, 21,900, 21,800 Resistance: 22,130, 22,230-22,325 (15-Minute Charts)
Positional Trading: Short-term Support: 21,750-21,150 Resistance: 22,250-22,800

BANK NIFTY OUTLOOK
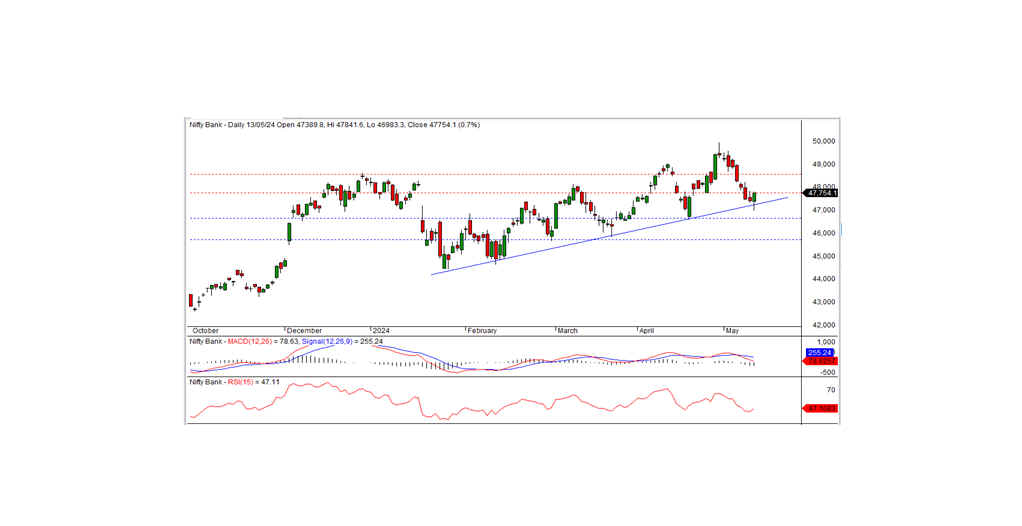
In the preceding trading session, Bank Nifty closed at 47,754.10, marking a notable gain of 333.00 points. Despite momentum indicators signaling a negative trend and the index remaining below short-term moving averages, a white candle formation on the daily chart closed just above the short-term resistance level of 47,750, indicating a mildly positive bias. Sustaining above the 47,750 level may fuel continued positive momentum in the days ahead. On the downside, the index finds trend line support at 47,200.
Intraday Levels: Support: 47,475, 47,200, 47,000 Resistance: 47,835, 48,150, 48,400 (15-Minute Charts)
Positional Trading: Short-term Support: 46,650-45,700 Resistance: 47,750-48,500

