NIFTY TECHNICAL OUTLOOK
Based on Market Closing on Tuesday, February 06, 2024
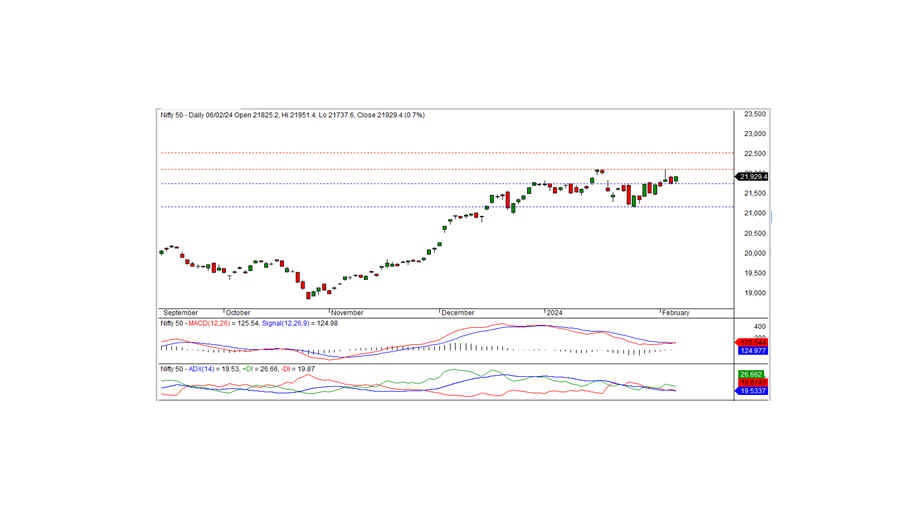
In the recent trading session, the Nifty concluded at 21929.40, marking an increase of 157.70 points or 0.72 percent. The upward momentum will likely persist should the Nifty surpass the intraday resistance of 21950.
Commencing at the level of 21825.20 with a positive bias, the Nifty initially dipped to an intraday low of 21737.60 then gradually rose and tested the intraday high of 21951.40. Eventually, it settled at 21929.40. Key sector gainers included IT, metal, auto, and pharma, whereas banks and FMCG experienced losses. The market breadth was positive, with 1472 stocks rising, 955 falling, and 102 remaining unchanged. Notable top gainers under the Nifty included BPCL, HDFCLIFE, HCLTECH, and TCS, while major losers were POWERGRID, BRITANNIA, INDUSINDBK, and ITC.
From a technical perspective, the Nifty remains positioned above both short-term and long-term moving averages, with momentum indicators signaling a positive trend. Additionally, the index formed a white candle on the daily chart and closed near the day's high, indicative of a bullish trend. The immediate intraday resistance for the index stands at 21950 levels. A sustained trade above this level could pave the way for further upside movements in the upcoming days. The nearest short-term support is anticipated at 21750 levels.
Intraday Support levels: 21845-21730-21645 Resistance levels: 21950-22040-22125 (15 Minute Charts)
. Positional traders' short-term support levels remain at 21750-21160, with resistance at 22125 -22500

BANK NIFTY
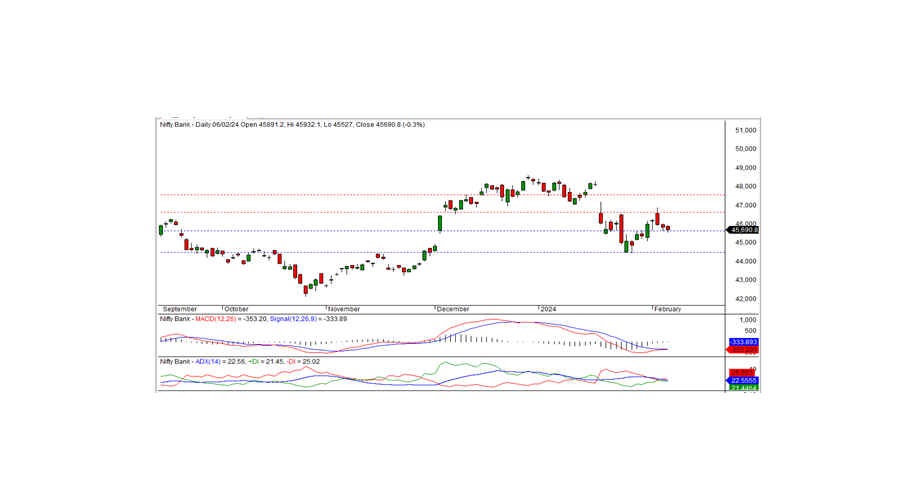
In the preceding trading session, the Bank Nifty concluded at 45690.80, marking a loss of -134.75 points. Technically, momentum indicators signal a negative trend, with the index positioned below short-term moving averages. Additionally, the index formed a black candle on the daily chart and closed below the previous day's close. On the downside, short-term support for the index is observed at 45600. A breach of this level may extend the downtrend in the forthcoming days. Conversely, if stays above the support level, a rebound rally could be anticipated from the support region.
For intraday traders, support levels are identified at 45600, 45400, and 45200, while resistance levels can be observed at 45850, 46050, and 46275, as indicated by the 15-minute charts.
Positional traders are advised to monitor short-term support levels at 45600-44450, with resistance at 46600-47550.

