NIFTY TECHNICAL ANALYSIS
Based on Market Closing on Monday, April 01, 2024
In the previous trading session, the Nifty concluded at 22,462.00, marking a gain of 135.10 points or 0.61 percent. Sustaining above the 22,400 level is crucial for maintaining the positive momentum.
The Nifty initiated the session on a positive note at 22,455.00 and surged to touch a record high of 22,529.90 before settling at 22,462.00. Except for the FMCG and auto sectors, all sectors closed with a positive bias. Media, realty, metal, and PSU banks emerged as the prominent gainers. Market breadth remained positive with 2,134 stocks advancing, 347 declining, and 90 unchanged. Notable gainers within the Nifty included JSWSTEEL, TATA MOTORS, DIVISLAB, and SHRIRAMFIN, whereas EICHERMOT, TITAN, NESTLEIND, and BAJAJ-AUTO experienced notable losses.
From a technical perspective, the Nifty closed above both short-term and long-term moving averages, with momentum indicators signaling a positive trend. Additionally, the index formed a Doji candle on the daily chart, closing significantly higher than the previous day, suggesting a potential continuation of the uptrend. Intraday support for the index lies at the 22,400 level, and sustaining above this level could reinforce the positive trend in the upcoming sessions. The nearest short-term resistance is at 22,500 levels.
Key Intraday Levels: Support - 22,400, 22,300, 22,200 Resistance - 22,500, 22,600, 22,700 (Based on 15-Minute Charts)
Positional Trading: Short-term Support - 21,850-21,200 Resistance - 22,500-23,000

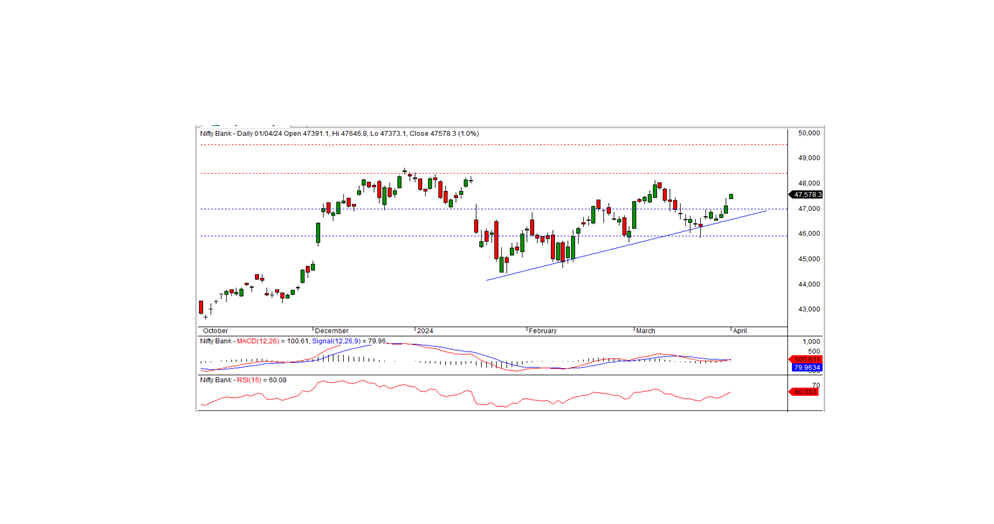
BANK NIFTY TECHNICAL ANALYSIS
In the previous trading session, Bank Nifty closed at 47,578.25, marking a gain of 453.65 points. Momentum indicators indicate a positive trend, with the index maintaining its position above both short- and long-term moving averages. On the daily chart, the index formed a white candle, closing higher than the previous day, indicating the uptrend may continue.
The nearest intraday resistance is situated at 47,600, while support holds at 47,400. A continuation of the positive trend today depends on the index surpassing the 47,600 level.
For intraday traders, key support levels are identified at 47,400, 47,200, and 47,000, while resistance levels can be observed at 47,600, 47,800, and 48,000, as indicated by the 15-minute charts.
Positional traders are advised to monitor short-term support levels at 47,000-46,000, with resistance anticipated at 48,500-49,500.