NIFTY TECHNICAL OUTLOOK
Based on Market Closing on Friday, April 05, 2024
During the last trading session, the Nifty closed at 22513.70, down -0.95 points. The prevailing positive sentiment is anticipated to persist as long as the Nifty maintains levels above 22500.
In the last trading session, the Nifty commenced trading at 22486.40, experiencing a bearish start and reaching an intraday low of 22427.60 in morning trade. However, the index gradually rebounded, peaking at an intraday high of 22537.60 before ultimately closing at 22513.70. Noteworthy sectoral gainers encompassed realty, banks, financial services, and FMCG, whereas IT, media, and auto sectors faced losses. Market breadth leaned towards positivity, with 1453 stocks ascending, 960 declining, and 167 remaining unchanged. Key performers under the Nifty included KOTAKBANK, SBILIFE, HDFCBANK, and BAJAJFINSV, while ULTRACEMCO, GRASIM, BAJAJ-AUTO, and BAJFINANCE incurred notable losses.
Technically, the Nifty continues to maintain positions above both short-term and long-term moving averages, with momentum indicators signaling a positive trajectory. The formation of a small white candle on the daily chart, coupled with sustained support above 22500, underscores the prevailing bullish momentum. Should the Nifty retain levels above 22500, the bullish trend is likely to extend in the forthcoming sessions, with the next immediate resistance located at 23000.
Intraday Levels: Support: 22480, 22420, 22360 Resistance: 22565, 22650, 22725 (15-Minute Charts)
Positional Trading: Short-term Support: 22500-21850 Resistance: 23000-23500.

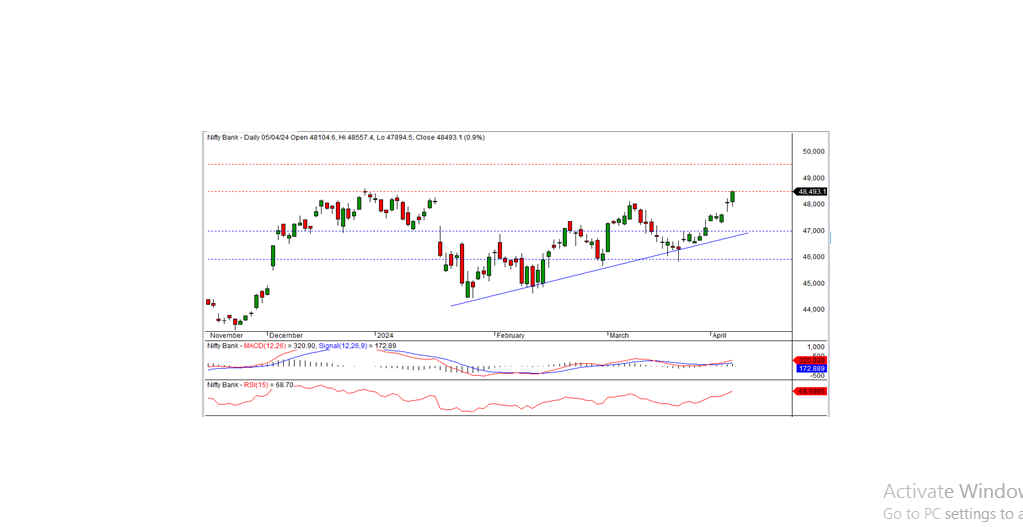
BANK NIFTY
In the preceding trading session, Bank Nifty closed at 48493.05 registering a gain of 432.25 points. Technically, the momentum indicators signal a positive trend. And the index remains above the short-term and long-term moving averages. Moreover, the index formed a white candle on the daily chart and closed near the resistance of 48500. If the index surpasses the resistance level of 48500, then the bullish trend can continue in the coming days. The next short-term resistance is at 49500 levels.
For intraday traders, the support levels are at 48400, 48200, and 48000, while resistance levels can be identified at 48600, 48800, and 49000 as indicated by the 15-minute charts.
Positional traders should monitor short-term support levels at 47000-46000, with resistance at 48500 -49500.