NIFTY TECHNICAL OUTLOOK
Based on Market Closing on Monday, December 11, 2023
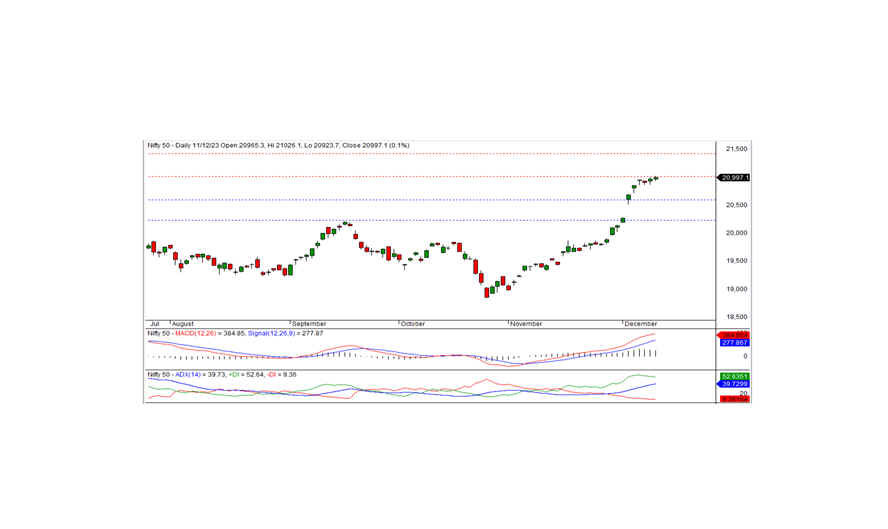
The Nifty concluded the trading session at 20997.10, registering a gain of 27.70 points or 0.13 percent. To sustain the bullish trend, the index must close above the short-term resistance of 21000.
Opening at the 20965.30 level on a flat note, the Nifty tested an intraday low of 20923.70. Subsequently, it ascended and reached an all-time high of 21026.10 before settling at 20997.40. Except for pharma and financial services, all sectors closed positively, with PSU banks, media, metal, and realty emerging as the leading sector gainers. The market breadth reflected positivity, with 1402 stocks rising, 943 falling, and 139 remaining unchanged.
Below the Nifty, UPL, ULTRACEMCO, ADANIENT, and LTIM were the top gainers, while DRREDDY, CIPLA, AXISBANK, and BPCL experienced losses.
From a technical perspective, the Nifty continues to be positioned above both short-term and long-term moving averages. Momentum indicators also indicate a robust positive trend. Additionally, the daily chart reveals a small white candle, closing above the previous day's close, suggesting the potential for a further uptrend.
On the upper side, the index faces resistance at 21000 levels. A successful close above this level could extend the bullish momentum in the coming days. Conversely, the index may undergo consolidation below this level for a few days.
Intraday Support Levels: 20950-20865-20800 Resistance Levels: 21030-21075-21150 (15-Minute Charts)
For positional traders, short-term support levels are maintained at 20600-20200, with resistance at 21000-21400.

BANK NIFTY
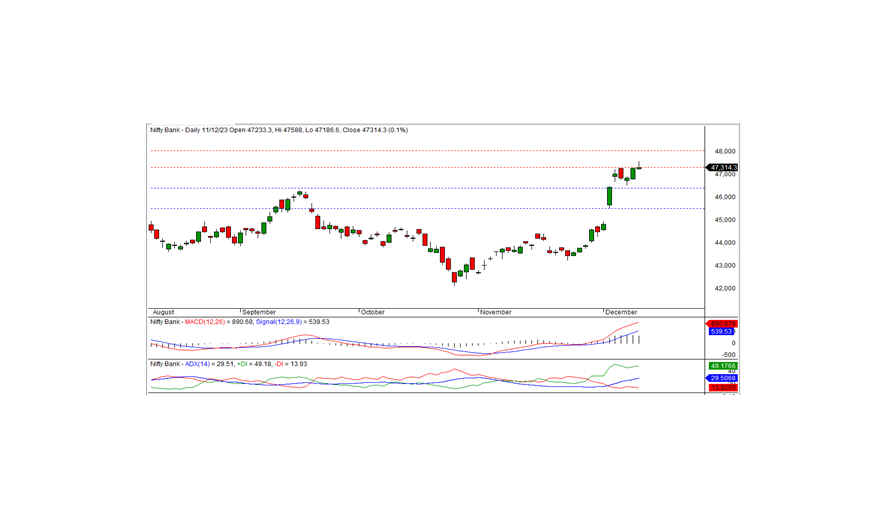
In the recent trading session, Bank Nifty concluded at 47314.30, marking a gain of 52.25 points. Analyzing from a technical standpoint, momentum indicators continue to signal a positive trend, and the index remains positioned above both short-term and long-term moving averages. Notably, the daily chart exhibits a white candle, reaching the all-time high of 47588, and ultimately closing just above the preceding short-term resistance of 47,300. Sustaining trading activity above this level may extend the bullish trend in the forthcoming days, with the next short-term resistance identified at 48000.
For intraday traders, support levels are observed at 47300, 47150, and 46900, while resistance levels are marked at 47600, 47800, and 48000, as indicated by the 15-minute charts.
Positional traders are advised to monitor short-term support levels at 46400-45500, with resistance noted between 47300 and 48000.

