
NIFTY TECHNICAL ANALYSIS
Market Close on Tuesday, December 26, 2023
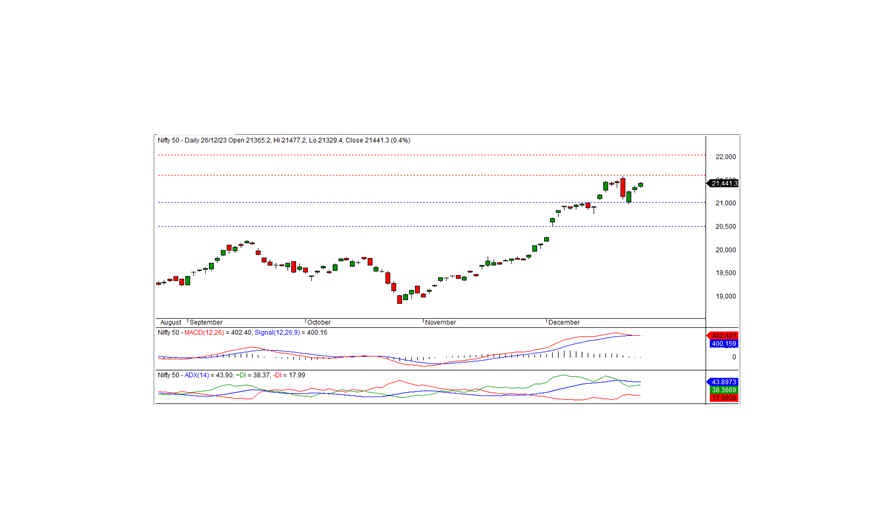
On Tuesday, December 26, 2023, the Nifty concluded the trading session at 21,441.35, registering a gain of 91.95 points or 0.43 percent. The bullish momentum is poised to persist if the index maintains its position above the crucial 21,400 level.
Commencing on a positive note at the 21,365.20 level, the upward trend persisted, reaching the intraday high of 21,477.20, ultimately settling at 21,441.35. Key sector gainers comprised metal, pharma, auto, and FMCG, while media, IT, and PSU banks faced losses. The overall market breadth reflected positivity, with 1,423 stocks advancing, 951 declining, and 121 remaining unchanged. Top gainers under the Nifty umbrella included DIVISLAB, HEROMOTOCO, NTPC, and ADANIENT, while significant losses were observed in BAJFINANCE, BAJAJFINSV, INFY, and TCS.
From a technical standpoint, the Nifty maintains its position above both short-term and long-term moving averages, affirming its strength. Momentum indicators corroborate this positive trend. Additionally, the formation of a white candle on the daily chart, surpassing the previous day's close, implies the potential continuation of the uptrend. On the downside, intraday support is evident at the 21,400 level, and sustaining this level could ensure the continuation of the positive trend for the day. The closest intraday resistance is anticipated at 21,500 levels.
Intraday Support and Resistance Levels (15-Minute Charts): Support Levels: 21,400 - 21,300 - 21,200 Resistance Levels: 21,500 - 21,600 - 21,700
For positional traders, short-term support levels are identified at 21,000-20,500, while resistance levels stand at 21,600-22,000.
BANK NIFTY Technical Analysis
In the previous trading session, Bank Nifty concluded at 47,724.85, marking a notable gain of 233.00 points. From a technical standpoint, momentum indicators continue to signal a positive trend, and the index maintains its position above both medium-term and long-term moving averages. Furthermore, the daily chart exhibits a white candle closing within the previous day's candle, resembling a bullish Harami pattern. This formation suggests a reversal of the previous downward bias. To confirm this reversal, it is essential for the index to trade and sustain above the high of the Harami pattern in the upcoming session.
On the upside, the index faces intraday resistance at 47,840, while support is identified at 47,635. To sustain the bullish trajectory, the index must breach the intraday resistance at 47,840. Conversely, a dip below the 47,635 level could hint at a slightly negative trend.
For intraday traders, support levels are observed at 47,645, 47,400, and 47,200, with corresponding resistance levels at 47,840, 48,070, and 48,220, as depicted by the 15-minute charts.
Positional traders are advised to monitor short-term support levels at 47,000-45,670, while resistance levels stand at 48,200-49,500.
