NIFTY TECHNICAL OUTLOOK
Based on Market Closing on Wednesday, January 17, 2024
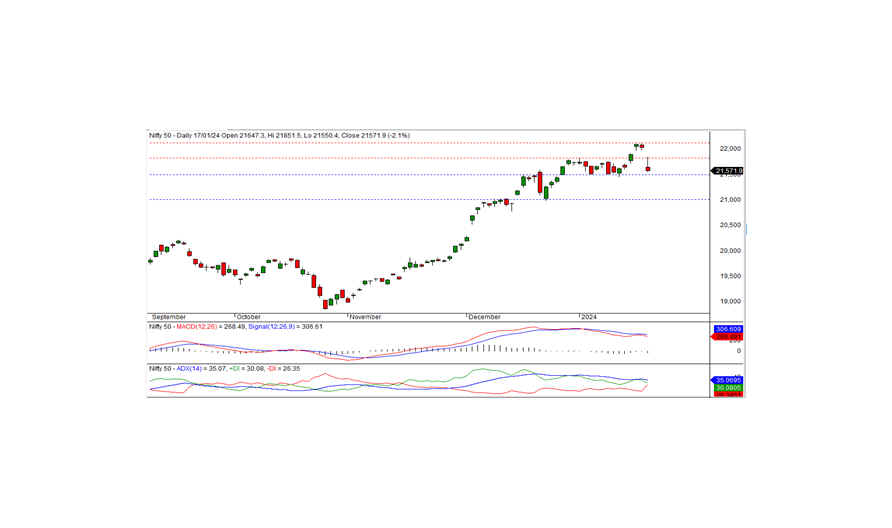
In the last trading session, the Nifty concluded at 21,571.95, experiencing a decline of -460.35 points or -2.09 percent. The ongoing downtrend is expected to persist if the Nifty closes below the crucial 21,500 level.
The Nifty commenced the session at 21,647.30, opening with a downward gap. This negative trajectory persisted, reaching an intraday low of 21,550.40 before settling at 21,571.95. All sectors, except IT, closed on a negative note, with notable declines in financial services, banks, metal, and auto. The market breadth skewed negative, with 715 stocks rising, 1,716 falling, and 86 remaining unchanged. Top gainers under the Nifty included HCLTECH, SBILIFE, LTIM, and TCS, while major losers were HDFCBANK, TATA STEEL, KOTAKBANK, and HINDALCO.
From a technical standpoint, the Nifty closed below its short-term moving averages, signaling a negative trend. Momentum indicators further affirm a downward trajectory. Additionally, the index formed a black candle, closing well below the previous day's close, indicating the potential for a continued downtrend. On the downside, the index finds short-term support at 21,500, and a closure below this level could extend the downtrend in the coming days. To initiate a pullback rally, the index must surpass the intraday resistance at 21,640.
Intraday Levels: Support: 21,550-21,475-21,400 Resistance: 21,640-21,735-21,820 (15-Minute Charts)
Positional Trading: Support: 21,500-21,000 Resistance: 21,820-22,125

BANK NIFTY
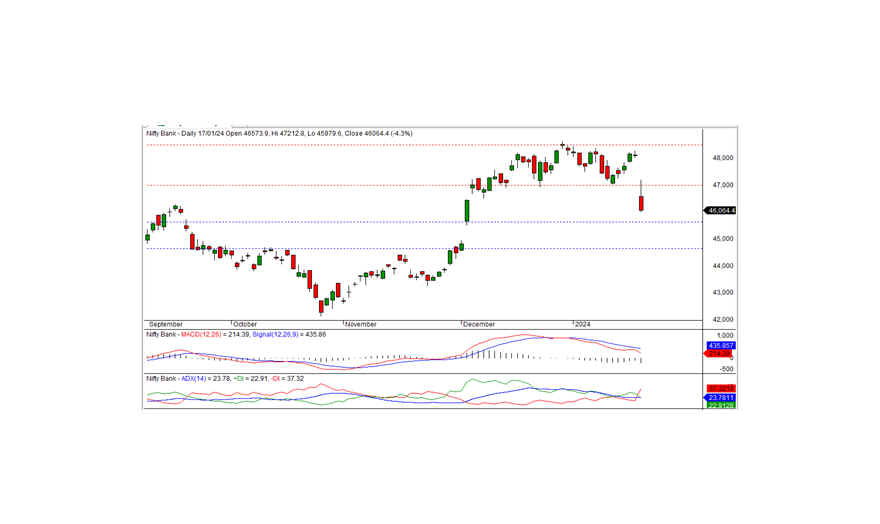
In the preceding trading session, Bank Nifty concluded at 46,064.45, marking a loss of -2,060.65 points. From a technical perspective, momentum indicators indicate a negative trend, and the index closed below both the short-term and medium-term moving averages. Additionally, a black candle formation on the daily chart, closing well below the previous day's close, emphasizes the bearish sentiment. On the downside, the index has intraday support at the 46,000 level; a move below this level may sustain the negative trend today. The nearest short-term support is at 45,600 levels. To establish a positive trend, the index must surpass the 46,320 level.
For intraday traders, support levels are identified at 46,000, 45,700, and 45,400, while resistance levels can be monitored at 46,320, 46,700, and 47,000, as indicated by the 15-minute charts.
Positional traders should keep a close eye on short-term support levels at 45,600-44,650, with resistance at 47,000 - 48,500.

