NIFTY TECHNICAL OUTLOOK
Based on Market Closing on Thursday, February 08, 2024
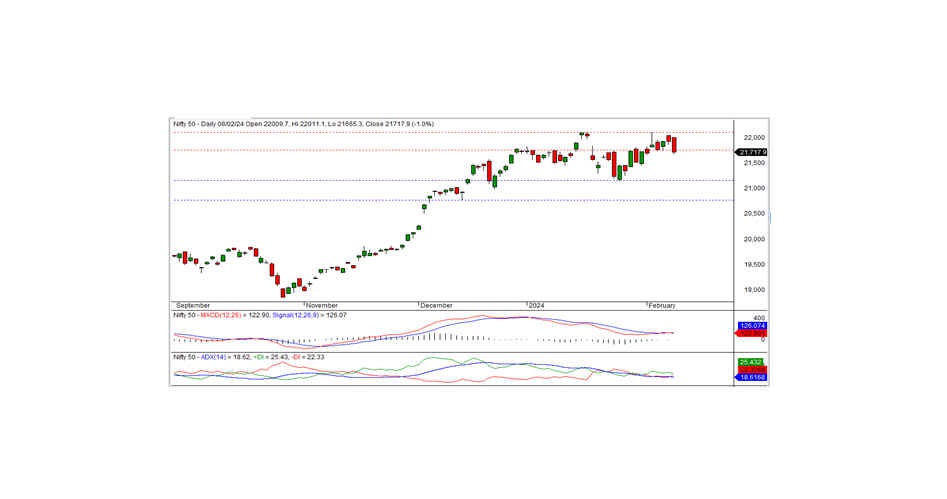
In the last trading session, the Nifty closed at 21717.95, down by -212.55 points or -0.97 percent. The downtrend is likely to persist in the coming days if the Nifty remains below the resistance level of 21750.
The Nifty opened positively at the 22009.70 level and reached an intraday high of 22011.10 during morning trade. However, the index gradually declined throughout the session, reaching an intraday low of 21665.30 before closing at 21717.95. Among the sectors, PSU banks, media, and IT showed gains, while private banks, FMCG, and financial services were major losers. Market breadth was negative, with 972 stocks rising, 1454 falling, and 103 remaining unchanged. SBIN, POWERGRID, BPCL, and HINDALCO were the top gainers, while ITC, BRITANNIA, KOTAKBANK, and ICICIBANK were major losers.
From a technical standpoint, the Nifty closed below short-term moving averages, and momentum indicators signal a neutral trend. Additionally, the index formed a black candle on the daily chart and closed below the previous support level of 21750. Further downside moves can be expected if the index trades and sustains below this level, with the next short-term support at 21160 levels.
Intraday Support levels: 21725-21650-21550 Resistance levels: 21800-21900-22000 (15-Minute Charts)
For positional traders, short-term support levels remain at 21160-20750, with resistance at 21750-22125.

BANK NIFTY
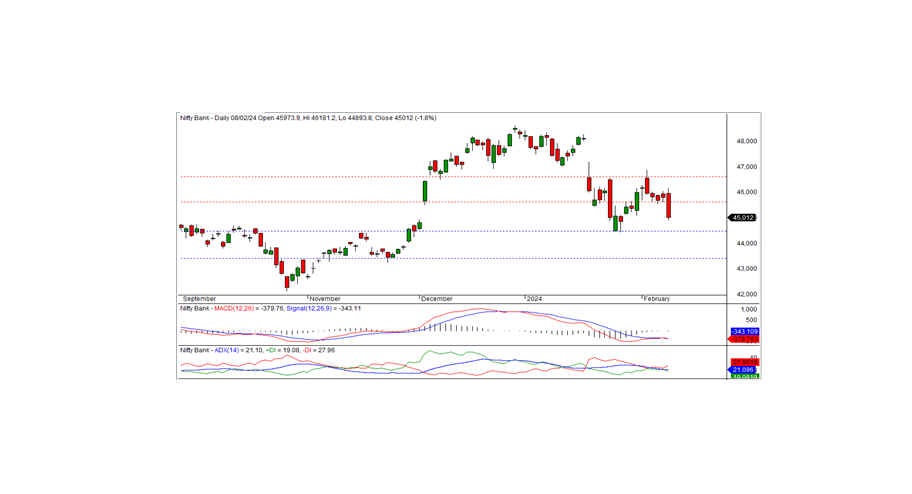
In the preceding trading session, Bank Nifty closed at 45012.00, marking a loss of -806.50 points. Technically, momentum indicators signal a negative trend, and the index remains below the short-term moving averages. Additionally, the index formed a black candle on the daily chart and closed below the previous support level of 45600. If the index remains below this level, the downtrend may persist in the coming days, with the next short-term support seen at the 44450 level. A pullback rally can be expected if the index surpasses the intraday resistance of 45200.
For intraday traders, support levels are identified at 45000, 44800, and 44600, while resistance levels can be observed at 45200, 45500, and 45750 as indicated by the 15-minute charts.
Positional traders should monitor short-term support levels at 44450-43400, with resistance at 45600 - 46600.

