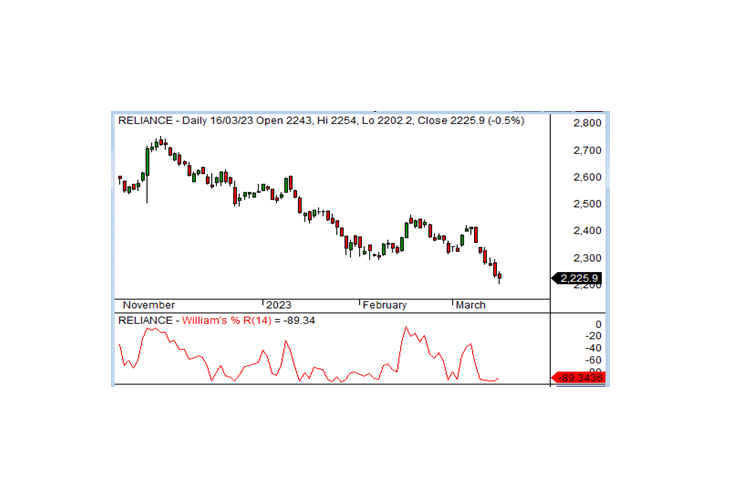
Williams %R
Williams %R (14) is a technical analysis indicator that measures the current closing price of a stock relative to the highest and lowest prices of the stock over the past 14 periods. The indicator is designed to identify overbought and oversold conditions in stock, similar to the Stochastic oscillator.
The Williams %R (14) indicator is created by subtracting the current closing price of the stock from the highest price over the past 14 periods, and then dividing that result by the difference between the highest and lowest prices over the past 14 periods. The resulting value is then multiplied by -100 to give a range between -100 and 0, with -100 representing oversold conditions and 0 representing overbought conditions.
Traders can use the Williams %R (14) indicator for buying and selling stocks in a few ways:
Overbought and oversold conditions: When the Williams %R (14) indicator crosses above -20, it is considered overbought, and when it crosses below -80, it is considered oversold. Overbought conditions may suggest that the stock's price has risen too far too fast and may be due for a pullback, while oversold conditions may suggest that the stock's price has fallen too far too fast and may be due for a rebound.
Divergence: Traders can also look for divergences between the Williams %R (14) indicator and the stock's price. If the stock is making new highs while the Williams %R (14) indicator is not, it may suggest that the uptrend is losing momentum and that it may be time to sell the stock. Conversely, if the stock is making new lows while the Williams %R (14) indicator is not, it may suggest that the downtrend is losing momentum and that it may be time to buy the stock.
It is important to note that the Williams %R (14) indicator, like all technical indicators, should be used in conjunction with other tools and analysis to make informed trading decisions. Additionally, traders should be aware of the limitations of the indicator, such as its tendency to give false signals in choppy or sideways markets.

