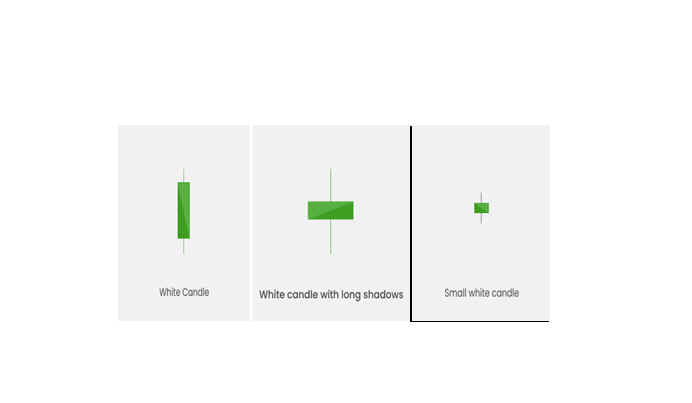
Candlestick Patterns: White candles
In technical analysis of financial markets, a white candlestick represents a bullish candlestick pattern. It is formed when the opening price of a security is lower than the closing price, indicating that the buyers have taken control of the market and pushed the price up.
There are different types of white candles that can form, depending on the position of the opening and closing prices relative to the high and low prices of the session. Here are some examples:
White candles with a large body: These candles have a large real body that indicates a significant price movement from the opening price to the closing price. When a stock or asset's price moves significantly in an upward direction during a particular timeframe, it can form a large white candle. It shows strong buying or bullish pressure.
White candles with long shadows: These candles have long shadows, which indicate high volatility during a particular timeframe. Long shadows can either be at the top or bottom of the candle, indicating that there was significant price movement in both directions during that timeframe. It can also signal a trend reversal in the future.
White candles with small real bodies and shadows: These candles have small real bodies and shadows, indicating that there was not much price movement during that timeframe. It may suggest that there was a period of consolidation or sideways trading in the market.
It's essential to note that the size and shape of these candles are just one aspect of technical analysis, and traders and investors need to combine it with other indicators and analysis tools to make informed trading decisions.

