NIFTY TECHNICAL OUTLOOK
Based on Market Closing on Wednesday, February 07, 2024
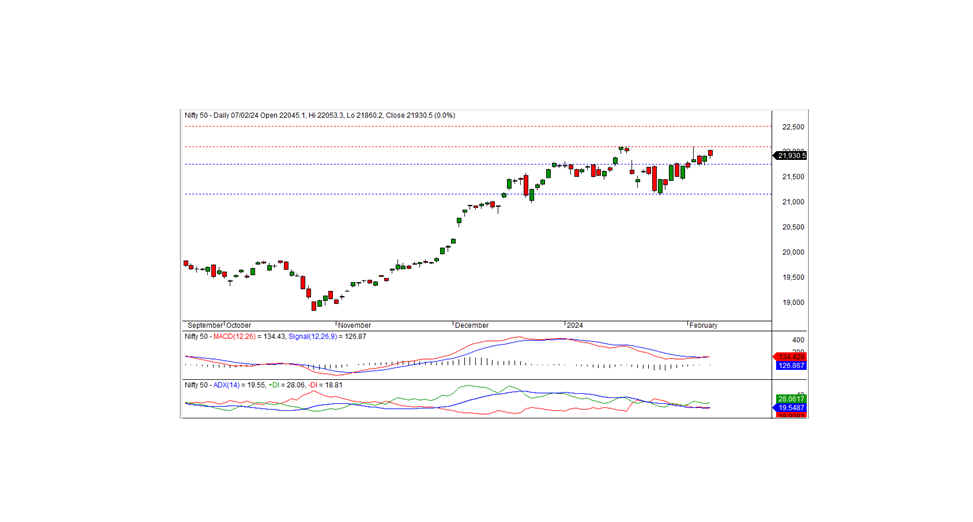
In the last trading session, the Nifty closed at 21930.50, a modest increase of 1.10 points or 0.01 percent. The upward trajectory will likely persist if the Nifty surpasses the intraday resistance at 21965.
Starting at 22045.10 with a positive bias, the Nifty reached an intraday high of 22053.30 in morning trade. However, the index gradually declined, touching an intraday low of 21860.20 before closing at 21930.50. Among the top sector gainers were PSU banks, realty, media, and metal, while IT, private banks, and auto experienced losses. The market breadth remained positive, with 1418 stocks rising, 1013 falling, and 98 remaining unchanged. Notable gainers under the Nifty included SBIN, GRASIM, JSWSTEEL, and HDFCLIFE, whereas TECHM, POWERGRID, INFY, and ADANIPORTS faced significant losses.
From a technical perspective, the Nifty continues to hold above both short-term and long-term moving averages, with momentum indicators signaling a positive trend. Although the index formed a black candle on the daily chart, it closed just above the previous day's close. On the higher side, intraday resistance stands at 21965 levels. Sustaining trade above this level may lead to further upside moves in the coming days. The nearest short-term support is located at 21750 levels.
Intraday Support Levels: 21865-21800-21725 Resistance Levels: 21965-22050-22125 (15 Minute Charts)
For positional traders, short-term support levels remain at 21750-21160, with resistance at 22125-22500.

BANK NIFTY
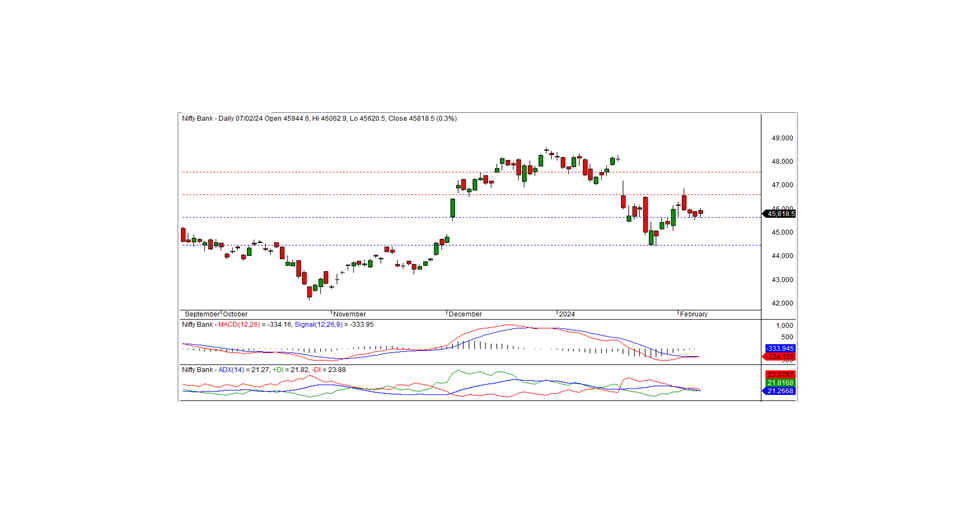
In the preceding trading session, Bank Nifty closed at 4581.50, gaining 127.70 points. Technically, momentum indicators signal a negative trend, with the index remaining below short-term moving averages. Although the index formed a black candle on the daily chart, it closed above the previous day's close. On the downside, short-term support for the index stands at 45600. If the index breaches this level, the downtrend may resume. For a pullback, the index needs to surpass intraday resistance at 46050.
For intraday traders, support levels are identified at 45800, 45600, and 45400, while resistance levels can be found at 46050, 46300, and 46535, as indicated by the 15-minute charts.
Positional traders should monitor short-term support levels at 45600-44450, with resistance at 46600-47550.

