NIFTY TECHNICAL OUTLOOK (Based on Market Closing on Thursday, February 01, 2024)
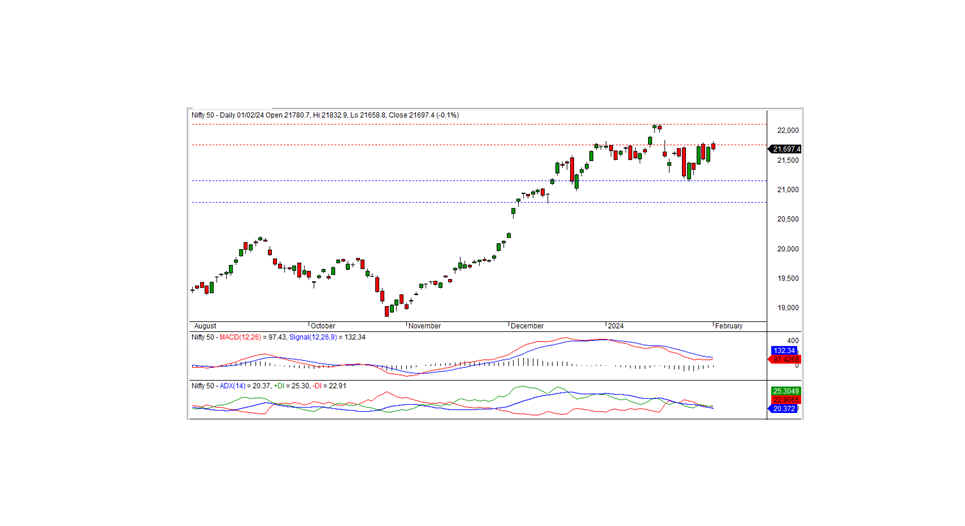
In the last trading session, the Nifty closed at 21697.45, down by -28.25 points or -0.13 percent. To establish a bullish trend, the index must surpass the resistance of 21750.
The Nifty opened positively at the 21780.70 level and reached an intraday high of 21832.90 in the morning trade. However, it gradually declined, touching the intraday low of 21658.80 before closing at 21697.45. Among the top sector gainers were banks, auto, and FMCG, while media, metal, realty, and pharma experienced significant losses. The market breadth leaned negative, with 1065 stocks rising, 1369 falling, and 89 remaining unchanged. Under the Nifty, MARUTI, CIPLA, POWERGRID, and EICHERMOT emerged as the top gainers, whereas ULTRACEMCO, LT, GRASIM, and DRREDDY were the major losers.
From a technical standpoint, the Nifty remains positioned above both short-term and long-term moving averages. Momentum indicators suggest a neutral trend. However, the index formed a small black candle on the daily chart, closing below the previous day's close. Facing significant resistance at 21750, the index needs to breach this level to signal a bullish trend. Otherwise, the recent consolidation may persist for a few more days below this resistance.
Intraday Support levels: 21650-21565-21475 Resistance levels: 21750-21850-21950 (15 Minute Charts)
For positional traders, short-term support levels remain at 21160-20780, with resistance at 21750-22125.

BANK NIFTY
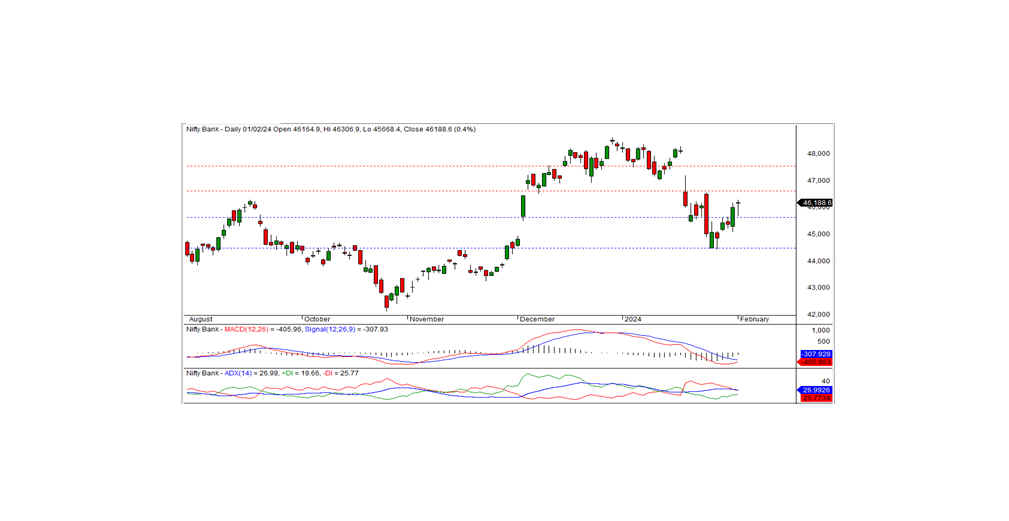
In the preceding trading session, Bank Nifty closed at 46188.65, marking a gain of 191.85 points. Technically, momentum indicators suggest a negative trend, yet the index remains above the short-term moving averages. A Doji candle formed on the daily chart, closing above the previous day's close.
On the higher side, the index faces intraday resistance at 46200. A breakthrough above this level could sustain the bullish trend in the forthcoming days. The subsequent short-term resistance is at 46600. The nearest intraday support stands at 45850.
For intraday traders, support levels are identified at 45850, 45670, and 45450, while resistance levels can be found at 46200, 46450, and 46700, as indicated by the 15-minute charts.
Positional traders should monitor short-term support levels at 45600-44450, with resistance at 46600 - 47550.

