Up channel patterns
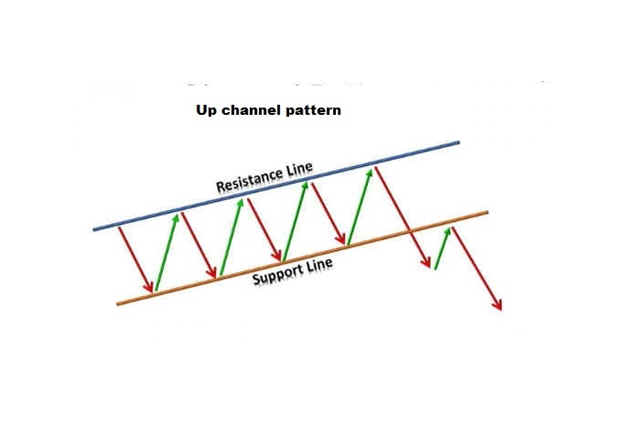
An up-channel pattern is a technical analysis pattern that forms when the price of an asset moves between two upward-sloping parallel trend lines. The lower trend line connects the lows of the price, while the upper trend line connects the highs of the price. This pattern indicates that the asset is in an uptrend, with higher highs and higher lows.
Here are some ways that traders use up channel patterns in their trading strategies:
Identifying potential entry points: Traders can use up channel patterns to identify potential entry points for long positions. They can buy the asset when it reaches the lower trend line, which acts as support. If the price rises and reaches the upper trend line, which acts as resistance, traders can sell their long position for a profit.
Setting stop-loss levels: Traders can use up channel patterns to set stop-loss levels to limit their potential losses. If the price breaks below the lower trend line, it can be an indication of a potential trend reversal. Traders can set their stop-loss orders just below the lower trend line to minimize their potential losses.
Identifying potential support and resistance levels: Traders can also use up channel patterns to identify potential support and resistance levels. The lower trend line can act as support, while the upper trend line can act as resistance. If the price breaks above the upper trend line, it can be an indication of a potential further increase in the price.
Using additional indicators: Traders can use additional technical indicators in combination with up-channel patterns to confirm their trading signals. For example, traders may use oscillators or momentum indicators to confirm overbought conditions when the price reaches the upper trend line.
In conclusion, up-channel patterns can be a useful tool in a trader's technical analysis toolkit for identifying potential entry and exit points, setting stop-loss levels, and identifying support and resistance levels. However, traders should combine this pattern with additional technical indicators and perform thorough analysis before making any trading decisions. As always, it's important to manage your risk and use appropriate position sizing to control your potential losses.