The trend line
A trend line is a technical analysis tool used in trading to identify the direction and strength of a trend. It's a straight line that connects two or more price points on a chart, typically plotted on a price chart of an asset over a certain period of time. A trend line can be drawn either by connecting the lows in an uptrend or the highs in a downtrend. Trend lines can be useful in trading because they can help traders identify areas of potential support and resistance.
When a trend line is drawn connecting a series of lows, it can act as a support level, while a trend line drawn connecting a series of highs can act as a resistance level. Traders can use trend lines in trading by looking for price action that interacts with the trend line. For example, if the price of an asset is in an uptrend and pulls back to the trend line, a trader may look for bullish price action to enter a long position. Conversely, if the price of an asset is in a downtrend and rallies up to the trend line, a trader may look for bearish price action to enter a short position.
Trading with an uptrend line
Trading with an uptrend line can be a useful strategy for traders who want to take advantage of an uptrend in an asset's price. Here is a possible approach for trading with an uptrend line:
Entry Level: The entry level for a trade with an uptrend line is typically when the price of the asset is touching or bouncing off the uptrend line. This can be a sign that the uptrend is continuing and that it's a good time to enter a long position. Another approach is to wait for a pullback in price to the uptrend line and then enter a long position when the price bounces off the line.
Target: The target for a trade with an uptrend line can be set at a resistance level above the current price. This can be a previous high or a psychological level that the price has had difficulty breaking through in the past. Traders can use technical analysis tools such as support and resistance levels, Fibonacci retracement levels, or chart patterns to identify potential target levels.
Stop Loss: The stop loss for a trade with an uptrend line can be set below the uptrend line or a recent swing low. This is to limit potential losses in case the price breaks below the uptrend line, which could indicate that the uptrend has ended. Traders can use technical analysis tools such as moving averages, Bollinger Bands, or the Average True Range (ATR) to help set their stop loss levels.

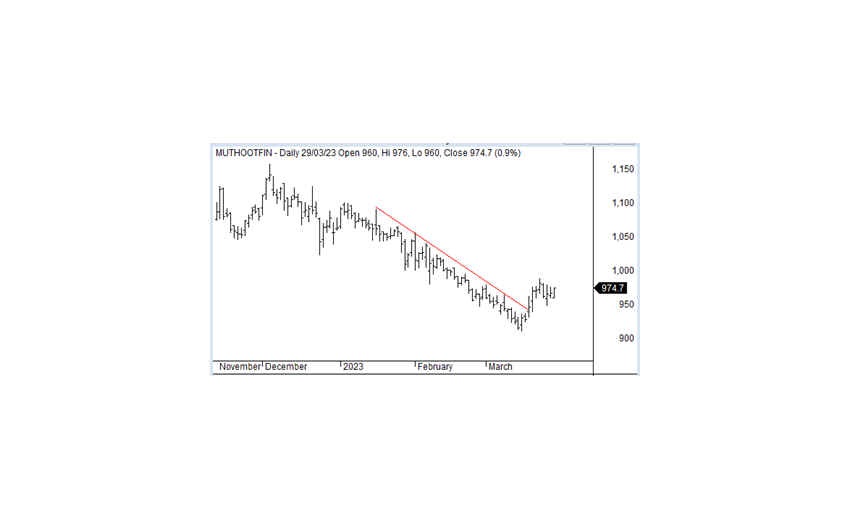
Trading with a downtrend line
Trading with a downtrend line can be a useful strategy for traders who want to take advantage of a downtrend in an asset's price. Here is a possible approach for trading with a downtrend line:
Entry Level: The entry level for a trade with a downtrend line is typically when the price of the asset is touching or bouncing off the downtrend line. This can be a sign that the downtrend is continuing and that it's a good time to enter a short position. Another approach is to wait for a rally in price to the downtrend line and then enter a short position when the price falls off the line.
Target: The target for a trade with a downtrend line can be set at a support level below the current price. This can be a previous low or a psychological level that the price has had difficulty breaking through in the past. Traders can use technical analysis tools such as support and resistance levels, Fibonacci retracement levels, or chart patterns to identify potential target levels.
Stop Loss: The stop loss for a trade with a downtrend line can be set above the downtrend line or a recent swing high. This is to limit potential losses in case the price breaks above the downtrend line, which could indicate a downtrend.
It's important to note that trading with a trend line is not a foolproof strategy, and there is always a risk of losses. Traders should always manage their risk by using appropriate position sizing and stop loss levels. Additionally, traders should use other technical analysis tools and indicators to confirm their analysis of the trend line and increase their chances of success.