NIFTY TECHNICAL OUTLOOK
As of Market Closing on Thursday, November 23, 2023
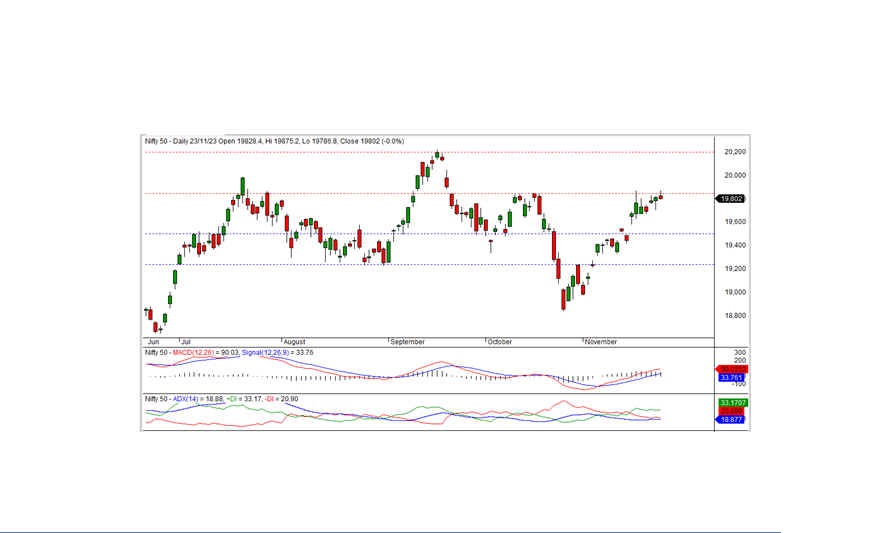
The Nifty concluded the trading session at 19,802.00, marking a loss of -9.85 points or -0.05 percent. The bullish momentum could potentially resume if the Nifty surpasses the short-term resistance at 19,850.
The day began positively, with the Nifty opening at 19,828.40 and reaching an intraday high of 19,875.20 in the morning trade. However, the index later experienced a decline, hitting an intraday low of 19,786.80, and ultimately closing at 19,802.00. Noteworthy sector gainers included realty, metal, media, and private banks, while the pharma, IT, and PSU bank sectors closed with a negative bias. The market breadth was positive, with 1,303 stocks rising, 1,037 falling, and 150 remaining unchanged.
Under the Nifty, HEROMOTOCO, BAJAJ-AUTO, BPCL, and EICHERMOT emerged as the top gainers, while CIPLA, ULTRACEMCO, LTIM, and LTIM faced significant losses.
From a technical standpoint, the Nifty remains positioned above both short-term and long-term moving averages, with momentum indicators signaling a positive trend. The daily chart reveals the formation of a small black candle, closing near the previous day's close, suggesting the possibility of consolidation. On the higher side, the Nifty encounters short-term resistance at the 19,850 level. A breakthrough beyond this level could reignite bullish momentum. The nearest intraday support is identified at 19,785 levels.
Intraday Levels (15-Minute Charts): Support: 19,785 - 19,750 - 19,700 Resistance: 19,830 - 19,875 - 19,925
For positional traders, short-term support levels are maintained at 19,500 - 19,233, with resistance levels at 19,850 - 20,200.

BANK NIFTY
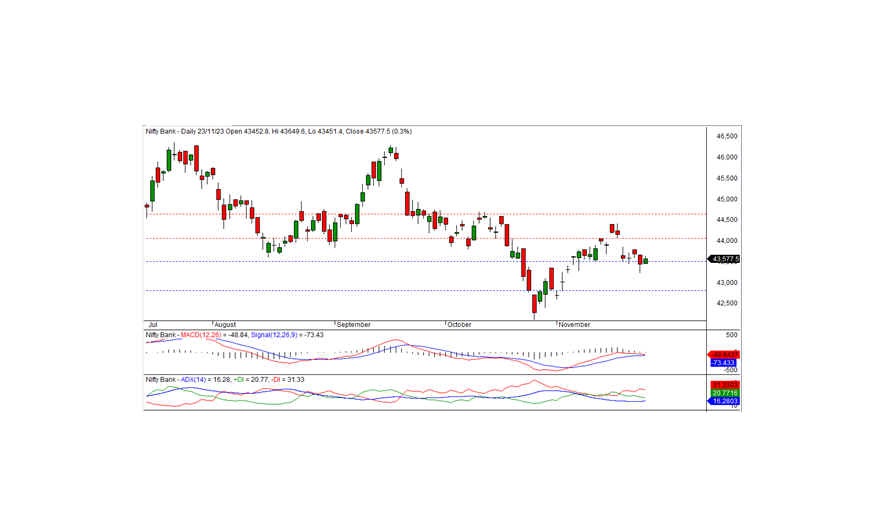
In the recent trading session, Bank Nifty concluded at 43,577.15, marking an uptick of 127.90 points. Analyzing the technical aspects, momentum indicators signify a positive trend, although the index remains positioned below short-term moving averages. Nevertheless, a white candle formation on the daily chart, closing above the prior day's close, is indicative of positive market sentiment. On the downside, the index finds short-term support at 43,500, and sustaining above this level could extend the positive trend today. The subsequent short-term resistance is identified at 44,000.
For intraday traders, support levels are marked at 43,500, 43,380, and 43,265, while resistance levels are evident at 43,650, 43,800, and 43,900, according to the 15-minute charts.
Positional traders are advised to monitor short-term support levels at 43,500-42,800, with resistance maintaining at 44,000 - 44,650.

