NIFTY TECHNICAL OUTLOOK
Based on Market Closing on Friday, June 14, 2024
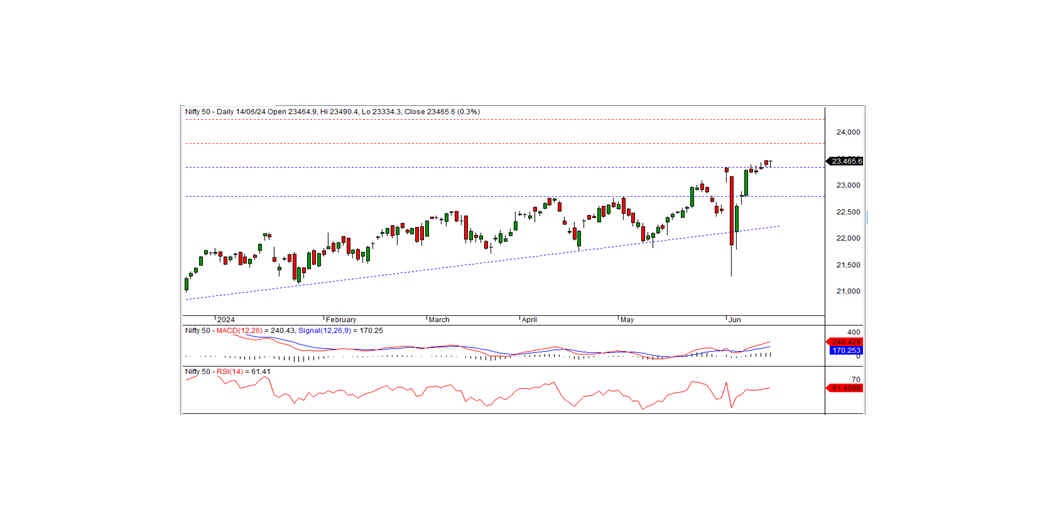
In the last trading session, the Nifty closed at a record high of 23,465.60, up 66.70 points or 0.29%. The positive trend will likely continue if the index surpasses the intraday resistance level of 23,485.
In the previous session, the Nifty opened positively at 23,464.90, dropped to an intraday low of 23,334.30 during the morning trade, then gradually rose to test an intraday high of 23,490.40, and finally closed at 23,465.60. The biggest gainers were the auto, realty, metal, and PSU bank sectors, while the IT and media sectors were the losers. The market breadth was positive, with 1,488 stocks rising, 1,019 falling, and 107 remaining unchanged. The top gainers under the Nifty were Eicher Motors, M&M, Adani Ports, and Shriram Finance, while the major losers included Tech Mahindra, TCS, Wipro, and HCL Tech.
From a technical standpoint, momentum indicators signal a positive trend. The Nifty remains above the long-term and short-term moving averages. The index formed a Doji candle on the daily chart but closed at a record high, indicating the possibility of continuing the uptrend. On the higher side, the index has intraday resistance at 23,485. If the index moves above this level, the bullish trend will continue in the coming days; otherwise, the index may consolidate below this level for a few days. The nearest intraday support is at 23,350.
Intraday Levels: Support: 23,350, 23,225, 23,100 Resistance: 23,485, 23,600-23,700 (15-Minute Charts)
Positional Trading: Short-term Support: 23,340-22,800 Resistance: 23,800-24,250
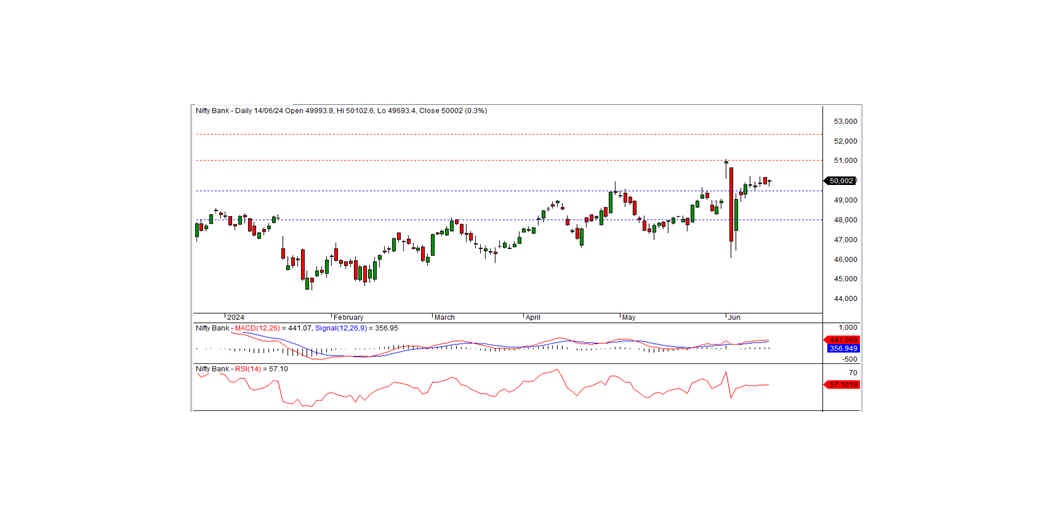
BANK NIFTY
In the preceding trading session, Bank Nifty closed at 50,002.00, registering a gain of 155.30 points. Technically, the momentum indicators signal a positive trend, and the index remains above the medium-term and short-term moving averages. The index formed a Doji candle on the daily chart and closed within the previous day's candle, indicating the possibility of consolidation.
On the lower side, the index has short-term support at the 49,500 level. If the index remains above this level, consolidation may continue for a few more days. The nearest intraday resistance is at the 50,100 level. To continue the uptrend, the index needs to surpass this level.
For intraday traders, the support levels are at 49,900, 49,700, and 49,500, while resistance levels can be identified at 50,100, 50,250, and 50,450 as indicated by the 15-minute charts.
Positional traders should monitor short-term support levels at 49,500-48,000, with resistance at 51,000-52,300.