NIFTY TECHNICAL OUTLOOK
As of the market closing on Thursday, March 07, 2024.
During the latest trading session, the Nifty achieved a new all-time high, closing at 22493.60, with a gain of 19.50 points or 0.09 percent. The positive trajectory is expected to persist today if the Nifty surpasses the 22525 level.
In the preceding trading session, the Nifty initiated positively, opening at the 22505.30 level, and reaching the peak of 22525.70 before settling at 22493.90. Noteworthy sectoral gainers included media, metal, FMCG, and pharma, while bank, auto, and realty sectors experienced losses. The market exhibited positive breadth, with 1464 stocks advancing, 976 declining, and 114 remaining unchanged. Leading the gainers were TATASTEEL, TATACONSUM, BAJAJ-AUTO, and TATAMOTORS, while prominent losers comprised M&M, BPCL, RELIANCE, and AXISBANK.
Technically, the Nifty maintains its position above both short-term and long-term moving averages. Momentum indicators indicate a favorable trend, and the daily chart reveals the formation of a Doji candle, concluding at a record high. The index faces intraday resistance at the 22525 level, and further upward movement can be anticipated if the index trades and sustains above this threshold. On the downside, the closest intraday support rests at 22450 levels.
Intraday Levels: Support - 22450, 22400, 22350 | Resistance - 22525, 22600, 22650 (15-Minute Charts)
Positional Trading: Short-term support - 22300-21835 | Resistance - 22750-23250.

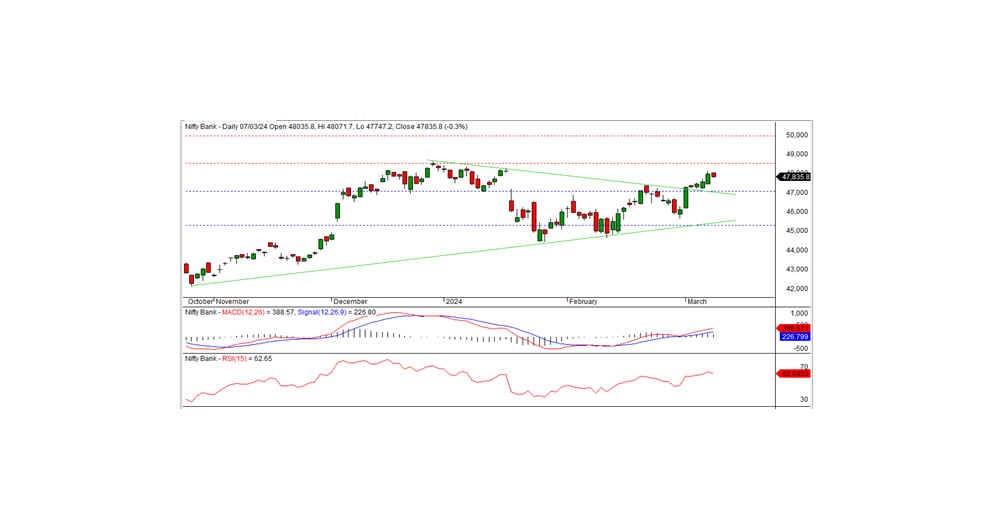
BANK NIFTY
In the most recent trading session, Bank Nifty concluded at 47835.80, reflecting a decrease of -129.60 points. Technically, the momentum indicators affirm a positive trend, and the index sustains its position above both short-term and long-term moving averages. Nevertheless, a small black candle emerged on the daily chart, closing below the previous day's conclusion. On the downside, the index finds intraday support at the 47750 level, and a continuation of the downtrend may ensue if the index falls below this threshold. The closest intraday resistance is situated at the 48000 level, and surpassing this point is crucial for the bullish trend.
For intraday traders, the support levels stand at 47750, 47550, and 47350, while resistance levels can be identified at 48000, 48165, and 48350 according to the 15-minute charts.
Positional traders are advised to monitor short-term support levels at 47000-45300, with resistance noted at 48500-50000.