NIFTY TECHNICAL OUTLOOK
Based on Market Closing on Thursday, July 04, 2024
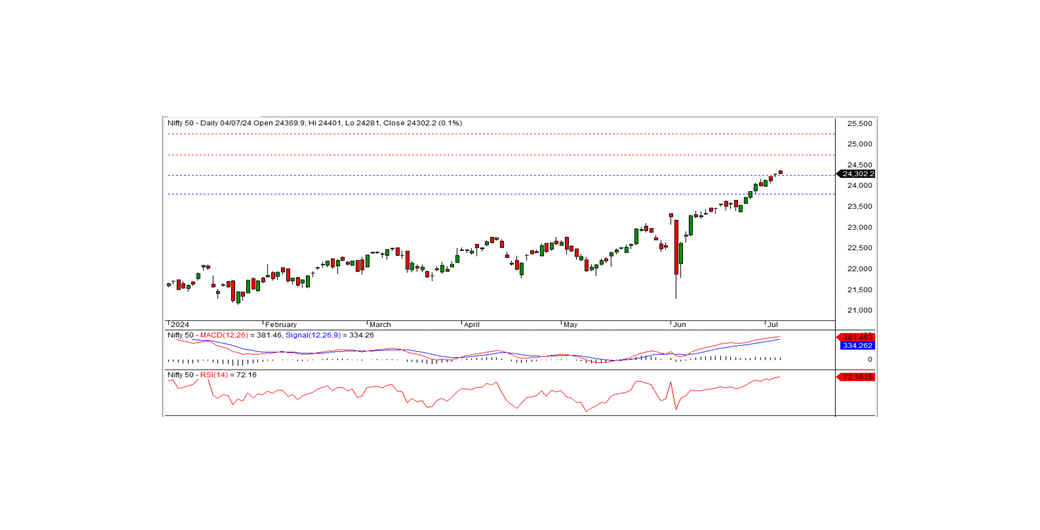
In the last trading session, the Nifty closed at 24,302.15, up 15.65 points or 0.06%. The bullish trend is expected to continue if the index remains above the 24,250 level.
The Nifty opened at 24,369.90 with a positive bias and tested a record high of 24,401. It then gradually fell, hitting an intraday low of 24,281 before closing at 24,302.15. Major gainers included the pharma, IT, auto, and realty sectors, while the media, FMCG, financial services, and metal sectors were the losers. Market breadth was positive with 1,372 stocks rising, 1,166 falling, and 95 remaining unchanged. The top gainers in the Nifty index were HCLTECH, ICICIBANK, TATAMOTORS, and SUN PHARMA. Conversely, the major losers were HDFCBANK, BAJFINANCE, WIPRO, and ADANIENT.
From a technical standpoint, momentum indicators signal a positive trend. The Nifty remains above both long-term and short-term moving averages. The index formed a black candle on the daily chart but closed at a record high, indicating a continuation of the bullish trend. The index has short-term support at the 24,250 level; if it trades and sustains above this level, the bullish trend can continue today. The nearest intraday resistance is at the 24,325 level.
Intraday Levels: Support: 24,250, 24,175, 24,100 Resistance: 24,325, 24,400-24,475 (15-Minute Charts)
Positional Trading: Short-term Support: 24,250-23,800 Resistance: 24,750-25,250
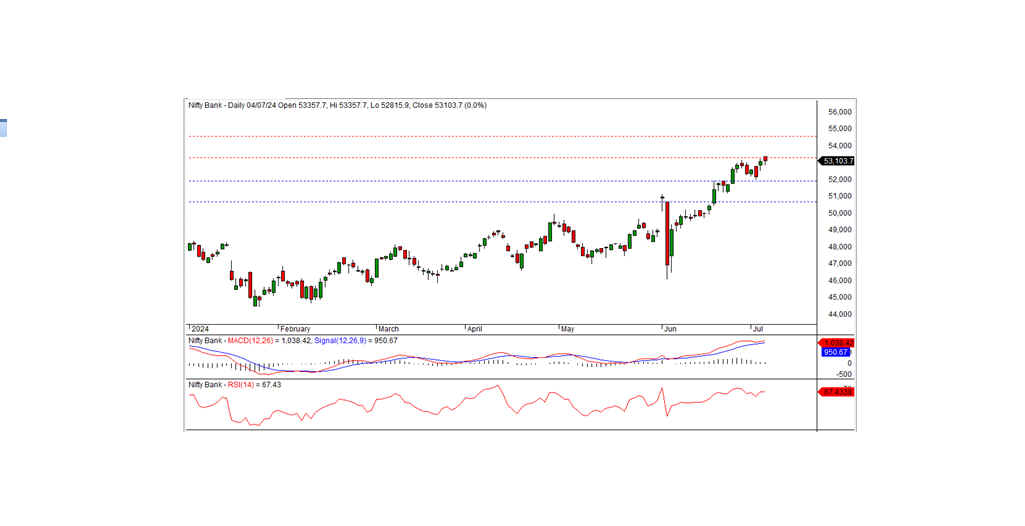
BANK NIFTY TECHNICAL OUTLOOK
In the preceding trading session, Bank Nifty closed at a record high of 53,103.70, registering a gain of 14.45 points. Technically, momentum indicators signal a positive trend, and the index remains above the medium-term and long-term moving averages. Despite forming a black candle on the daily chart, it closed above the previous day's close.
On the higher side, the index has short-term resistance at the 53,250 level. If the index closes above this level, the bullish trend can continue in the coming days. Otherwise, the index may consolidate below this level for a few days. The nearest intraday support is at the 53,000 level.
Intraday Levels: Support: 53,000, 52,750, 52,500 Resistance: 53,250, 53,500, 53,750 (15-Minute Charts)
Positional Trading: Short-term Support: 51,900-50,650 Resistance: 53,250-54,500