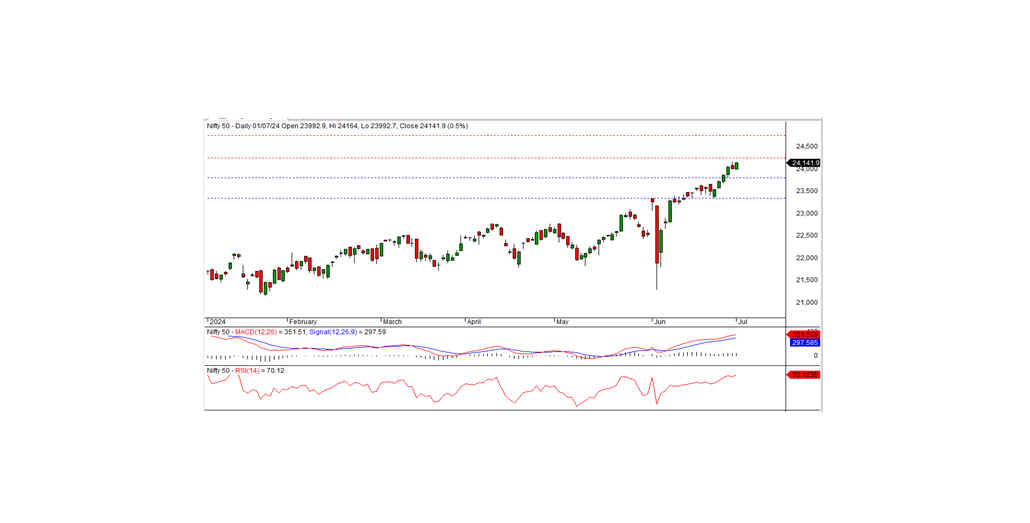
NIFTY Technical Outlook
Based on Market Closing on Monday, July 1, 2024
In the last trading session, the Nifty closed at 24,141.95, up 131.35 points or 0.55%. The bullish trend will continue if the Nifty moves above the 24,175 level.
The index opened at 23,992.90 with a negative bias, which marked the day's low. It then gradually rose, testing an intraday high of 24,164.00, and finally closed at 24,141.95. The top gainers were the media, IT, financial services, and FMCG sectors, while PSU banks and realty sectors underperformed. Market breadth was positive, with 1,341 stocks rising, 1,176 falling, and 103 remaining unchanged. The top gainers in the Nifty index included TECHM, WIPRO, BAJFINANCE, and GRASIM, while the major losers were NTPC, SBIN, EICHERMOT, and DRREDDY.
From a technical standpoint, momentum indicators signal a positive trend, with the Nifty remaining above long-term and short-term moving averages. The index formed a white candle on the daily chart and closed near a record high, indicating a potential continuation of the bullish trend. The intraday resistance is at 24,175, and if the index moves above this level, the bullish trend is likely to persist. The nearest intraday support is at 24,100.
For intraday trading, support levels are 24,100, 24,000, and 23,900, while resistance levels are 24,175, 24,250-24,325 (15-Minute Charts).
For positional trading, short-term support levels are 23,800-23,350, and resistance levels are 24,250-24,750.
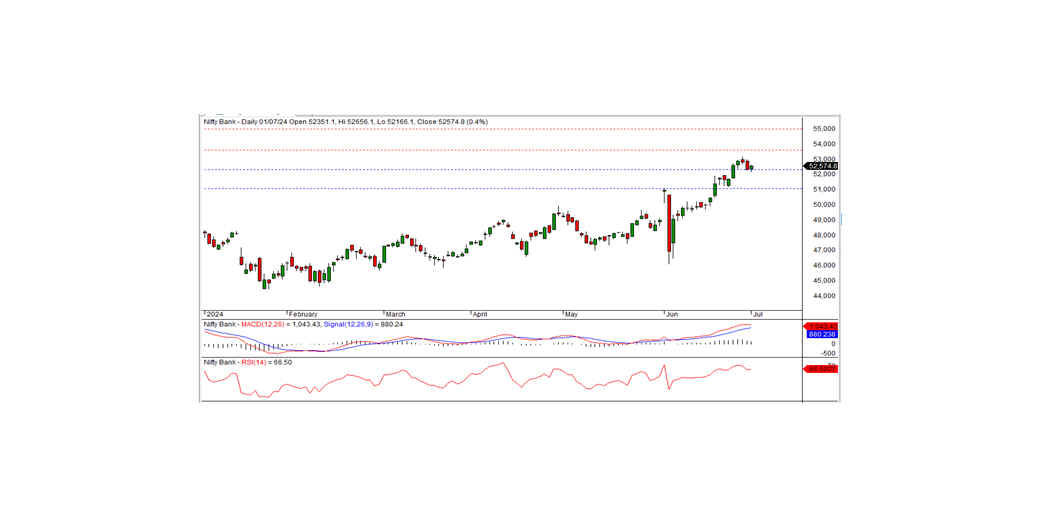
BANK NIFTY Technical Outlook
Based on Market Closing on Monday, July 1, 2024
In the preceding trading session, Bank Nifty closed at 52,574.75, registering a gain of 232.50 points. Technically, the momentum indicators signal a positive trend, with the index remaining above both the medium-term and short-term moving averages. Additionally, the index formed a white candle on the daily chart and closed above the previous day's close, reinforcing the bullish outlook. On the lower side, the index has intraday support at the 52,500 level. The positive bias can continue today if the index remains above this level. The nearest intraday resistance is at 52,750.
For intraday traders, the support levels are at 52,500, 52,200, and 52,000, while resistance levels can be identified at 52,750, 53,000, and 53,250 as indicated by the 15-minute charts.
Positional traders should monitor short-term support levels at 52,300-51,000, with resistance at 53,600-55,000.