NIFTY TECHNICAL OUTLOOK
Based on the Market Closing on Wednesday, November 15, 2023
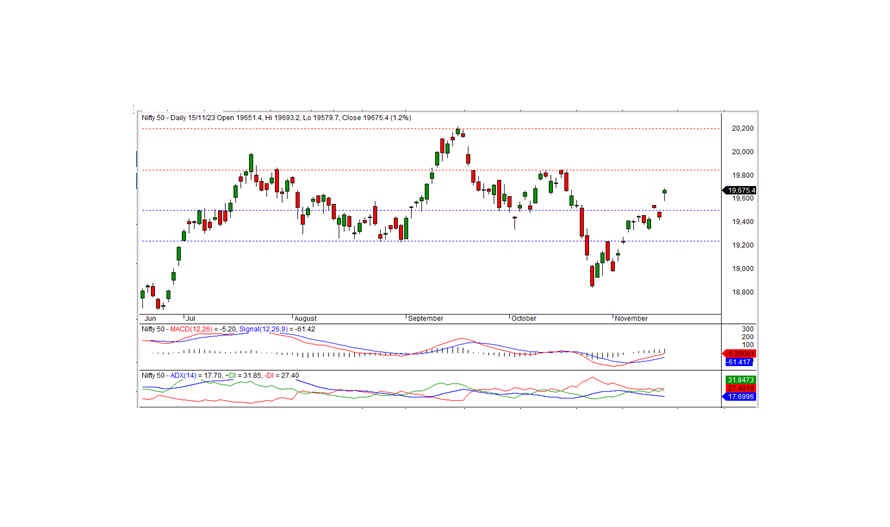
The Nifty concluded the trading session at 19,675.45, posting a gain of 231.90 points or 1.19 percent. The bullish trend may persist today if the Nifty continues to trade and sustain above 19,700.
Opening at 19,651.40 with an upward gap, the Nifty touched an intraday low of 19,579.70 before rising further. Subsequently, the index rose and tested an intraday high of 19,693.20, ultimately closing at 19,675.40. All sectors exhibited a positive bias, with realty, IT, auto, and metal emerging as the most significant gainers. Market breadth reflected positivity, with 1,485 stocks rising, 872 falling, and 133 remaining unchanged. Notable performers beneath the Nifty included EICHERMOT, TECHM, HINDALCO, and TATAMOTORS as the top gainers, while BAJFINANCE, INDUSINDBK, and POWERGRID experienced notable losses.
From a technical perspective, the Nifty remains above short-term and long-term moving averages, with momentum indicators signaling a positive trend. The index formed a white candle on the daily chart and closed above the previous day's close, suggesting the potential for a further uptrend. The nearest intraday resistance is identified at the 19,700 level. If it surpasses this level, the bullish trend can continue in the coming days, with the next short-term resistance at the 19,850 level.
Intraday Support Levels: 19,615 - 19,550 - 19,480 Resistance Levels: 19,700 - 19,775 - 19,850 (15 Minute Charts)
For positional traders, short-term support levels remain at 19,500 - 19,233, with resistance at 19,850 - 20,200.

BANK NIFTY UPDATE
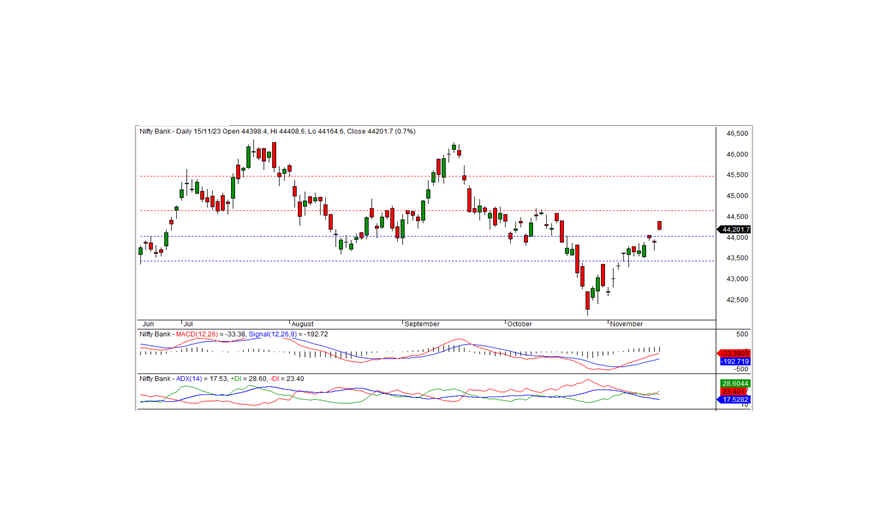
In the preceding trading session, Bank Nifty concluded at 44,201.70, marking a gain of 310.45 points. From a technical standpoint, momentum indicators affirm a positive trend, with the index positioned above the short-term moving averages.
On the daily chart, the index formed a black candle but closed above the prior day's conclusion, signaling a positive bias. Intraday resistance stands at 44,400, while support is at 44,150. Sustaining the bullish trend necessitates the index moving beyond 44,400. Conversely, a drop below the 44,150 level may lead to the filling of the gap created in the previous session.
For intraday traders, support levels are identified at 44,150, 44,035, and 43,900, with corresponding resistance levels at 44,400, 44,550, and 44,700, as depicted by the 15-minute charts.
Positional traders are advised to monitor short-term support levels at 44,000-43,500, while resistance is anticipated within the range of 44,650 to 45,500.

