NIFTY TECHNICAL OUTLOOK
Based on the market close on Tuesday, January 02, 2024
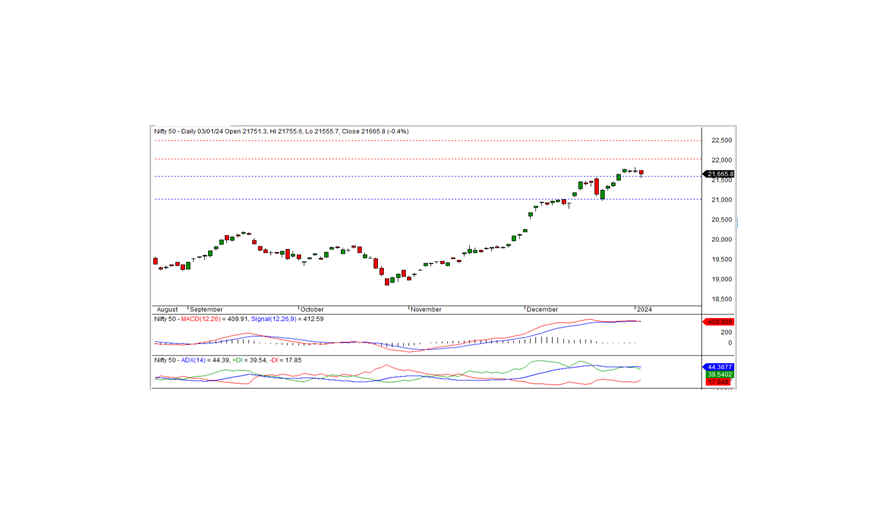
The Nifty concluded the trading session at 21665.80, recording a loss of -76.10 points or -0.35 percent. The closest support level is identified at 21600; a breach below this level may signify a further downward movement.
Commencing at 21751.30, the Nifty started the day on a positive note but experienced a decline, reaching an intraday low of 21555.70. However, during afternoon trading, the index rebounded from the low and ultimately settled at 21665.80. Pharma, media, and metal sectors closed with a positive bias, whereas auto, private bank, IT, and realty witnessed notable losses. Market breadth was negative, with 1121 stocks rising, 1234 falling, and 152 remaining unchanged.
Key gainers under the Nifty included ADANI PORTS, DIVISLAB, SUN PHARMA, and COAL INDIA, while major losers were EICHERMOT, M&M, ULTRACEMCO, and LT.
Technically, the Nifty remains positioned above both short-term and long-term moving averages, with momentum indicators signaling a neutral trend. The daily chart reveals the formation of a small black candle, closing below the previous day's close, suggesting a slightly negative bias. Short-term support is identified at 21600; a breach could lead to further downside, while consolidation above this level may occur in the absence of such a breach.
Intraday support levels: 21600-21530-21450 Resistance levels: 21680-21750-21830 (15 Minute Charts)
For positional traders, short-term support levels are at 21600-21000, with resistance at 22000-22500.

BANK NIFTY
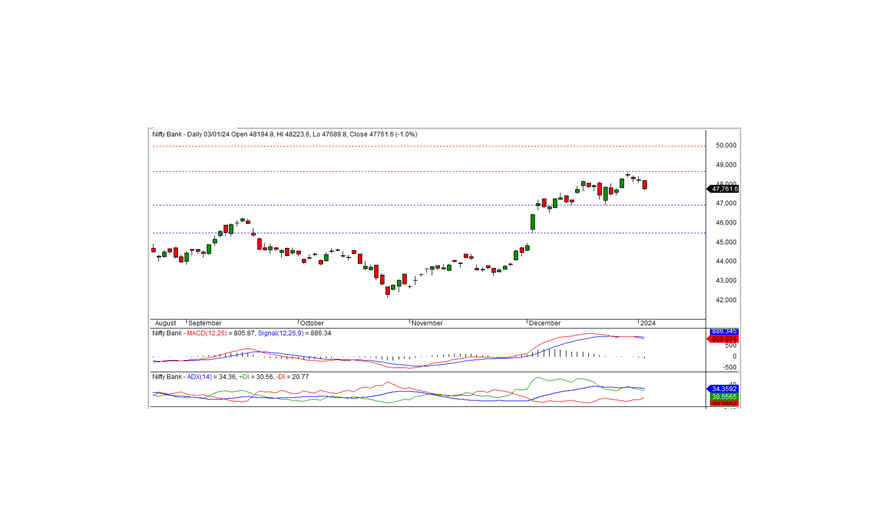
In the recent trading session, Bank Nifty concluded at 47761.65, experiencing a decline of -472.65 points. From a technical standpoint, momentum indicators indicate a neutral trend, and the index closed below its short-term moving averages. Additionally, a black candle formed on the daily chart, closing below the previous day's close, signaling a slightly negative trend. Intraday support is identified at 47600, and a continuation of the negative trend may occur if the index drops below this level. The closest intraday resistance is positioned at the 47800 level.
For intraday traders, support levels are observed at 47600, 47400, and 47200, while resistance levels are delineated at 47800, 48000, and 48200, as indicated by the 15-minute charts.
Positional traders are advised to monitor short-term support levels at 47000-45500, with resistance noted at 48650-50000.

