NIFTY TECHNICAL OUTLOOK
Based on Market Closing on Tuesday, January 30, 2024
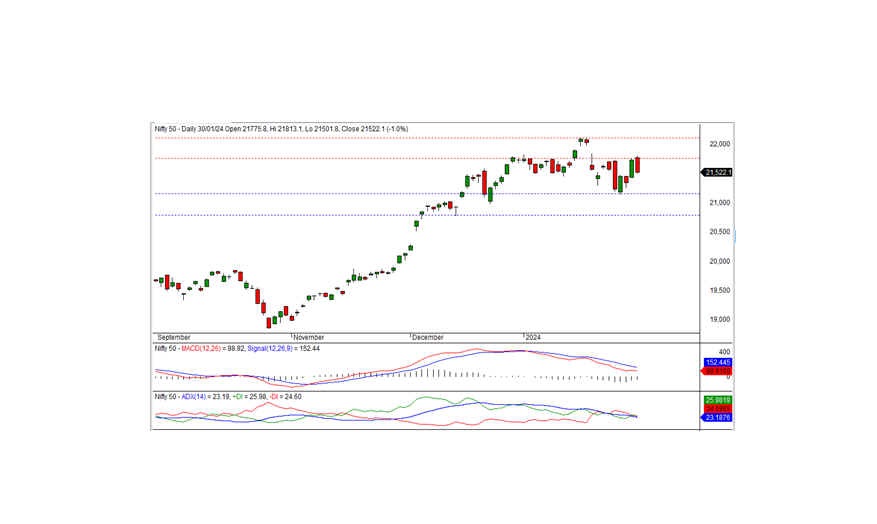
In the last trading session, the Nifty closed at 21522.10, down by -215.50 points or 0.99 percent. The downtrend may persist if the Nifty moves below the support level of 21475.
The Nifty opened at 21775.80, starting on a positive note, and reached an intraday high of 21813.10 in the morning trade. However, the index gradually declined and reached an intraday low of 21501.80, and finally closed at 21522.10. Among the sectors, PSU banks, media, realty, and metal were the gainers, while FMCG, pharma, financial services, and IT faced losses. The market breadth was negative, with 1216 stocks rising, 1210 falling, and 96 remaining unchanged. BPCL, TATA MOTORS, GRASIM, and EICHERMOT were the top gainers, while BAJFINANCE, TITAN, ULTRACEMCO, and BAJAJFINSV were among the major losers.
From a technical perspective, the Nifty remains above the long-term moving averages but closed below the short-term averages. The momentum indicators signal a negative bias. Moreover, the index formed a long black candle on the daily chart and closed well below the previous day's close. On the downside, the index has intraday support at 21475. If the index moves below this level, a further downtrend can be expected in the coming days. Otherwise, a pullback rally can be expected from the support area.
Intraday Support levels: 21475-21370-21250 Resistance levels: 21570-21665-21765 (15 Minute Charts)
For positional traders, short-term support levels remain at 21160-20780, with resistance at 21750-22125.
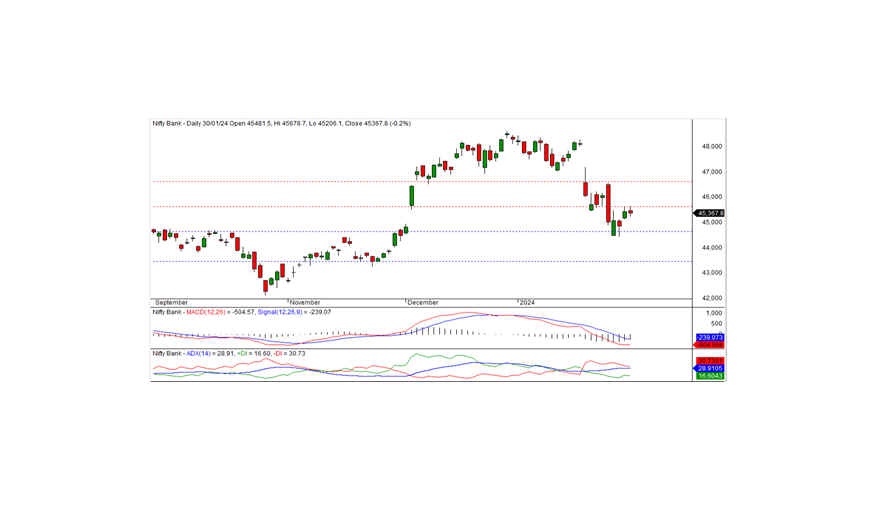
BANK NIFTY
In the preceding trading session, Bank Nifty closed at 45367.75, marking a loss of -74.60 points. From a technical standpoint, momentum indicators signal a negative trend, with the index closing below the short-term moving averages. Furthermore, the index formed a black candle on the daily chart and closed below the previous day's close, suggesting the possibility of continued consolidation. On the upside, the index faces short-term resistance at the 45600 level. If the index remains below this level, the consolidation could persist in the coming days. To establish a positive trend, the index needs to close above 45600.
For intraday traders, support levels are identified at 45250, 45000, and 44650, while resistance levels can be found at 45650, 46000, and 46250, as indicated by the 15-minute charts.
Positional traders should monitor short-term support levels at 44600-43500, with resistance at 45600-46600.