NIFTY TECHNICAL OUTLOOK
Based on Market Closing on Tuesday, March 05, 2024
In the last trading session, the Nifty closed at 22356.30, down 49.30 points or 0.22 percent. The downtrend may persist today if the Nifty trades and sustains below the 22430 level.
During the session, the Nifty opened at the 22371.30 level on a negative note and reached an intraday low of 22440.90 in the morning trade. Subsequently, the index gradually climbed and tested the intraday high of 22416.90 before closing at 22356.30. The PSU bank, auto, pharma, and realty sectors were the biggest gainers, while media, IT, and FMCG faced losses. The market breadth was negative, with 724 stocks rising, 1692 falling, and 136 remaining unchanged. Among the top gainers were TATAMOTORS, BHARTIARTL, BAJAJ-AUTO, and ONGC, while the major losers included BAJAJFINSV, BAJFINANCE, NESTLEIND, and INFY.
From a technical standpoint, the Nifty remains above both short-term and long-term moving averages. Momentum indicators signal a positive trend, yet the index formed a Doji candle on the daily chart and closed below the previous day's close. Over the last three trading sessions, the index has consolidated within a narrow trading band. On the upside, the Nifty faces intraday resistance at 22430. Further consolidation could occur if the index trades and maintains levels below this mark. Conversely, short-term support lies at 22300 levels.
Intraday Levels: Support - 22340, 22270, 22200 Resistance - 22430, 22500, 22570 (15-Minute Charts)
Positional Trading: Short-term support - 22300-21835 Resistance - 22750-23250

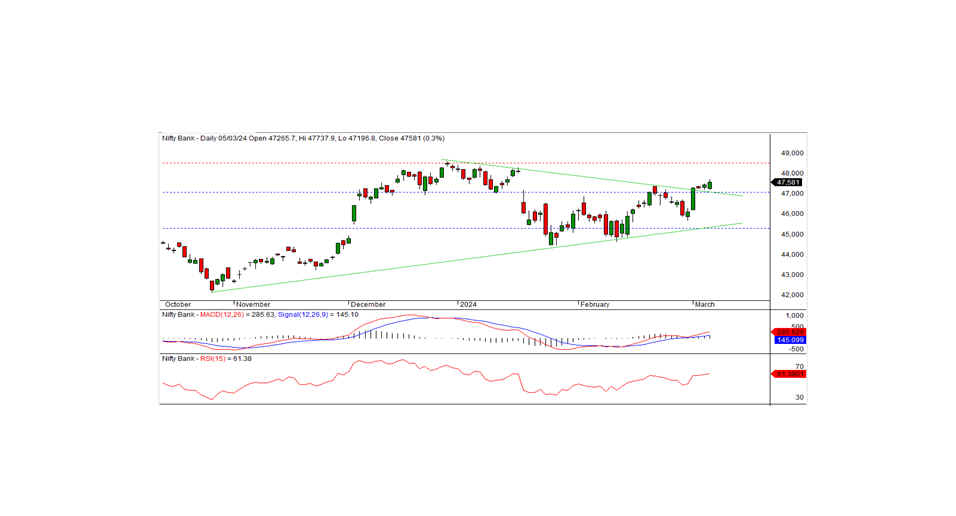
BANK NIFTY
In the preceding trading session, Bank Nifty closed at 47581.00, marking a gain of 124.90 points. Technically, momentum indicators signal a positive trend, with the index positioned above both short-term and long-term moving averages. Furthermore, the index formed a white candle on the daily chart and closed above the previous day's close, indicating a continuation of the positive trend. On the downside, the index finds intraday support at 47500, while resistance is observed at 47720. Should the index breach the 47720 level, the positive trend may extend in the forthcoming days.
For intraday traders, support levels are identified at 47500, 47200, and 47000, while resistance levels can be found at 47720, 47950, and 48150 as indicated by the 15-minute charts.
Positional traders should monitor short-term support levels at 47000-45300, with resistance at 48500.