NIFTY TECHNICAL OUTLOOK
Based on Market Closing on Thursday, January 25, 2024
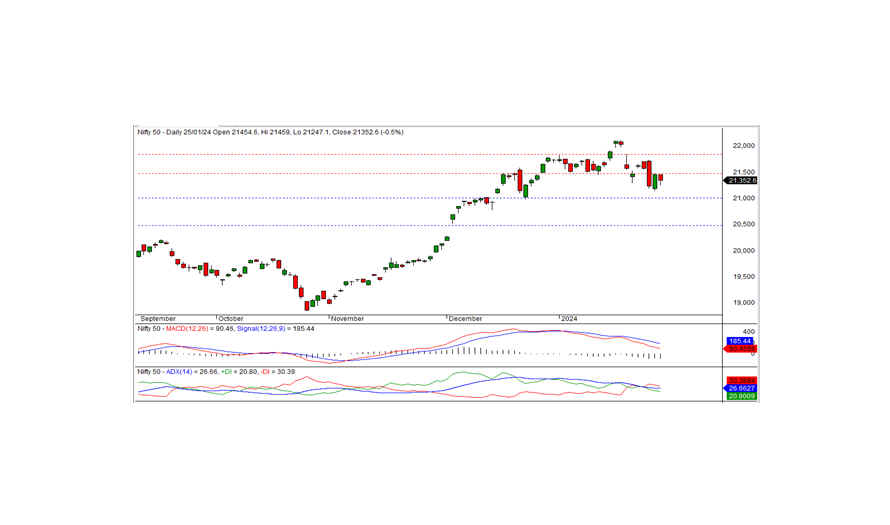
In the last trading session, the Nifty closed at 21352.60, down by -101.35 points or -0.47 percent. The downtrend will persist in the coming days if the Nifty remains below 21500.
The Nifty opened flat at the 21454.60 level and gradually declined, reaching an intraday low of 21247.10 during morning trade. However, the index rebounded from the day's low and closed at 21352.60. Realty, media, metal, and PSU banks emerged as the top sector gainers, while IT, pharma, FMCG, and financial services suffered losses. The market breadth was positive, with 1373 stocks rising, 1050 falling, and 97 remaining unchanged. Notable gainers under the Nifty included BAJAJ-AUTO, ADANI PORTS, NTPC, and COAL INDIA, while major losers comprised TECHM, CIPLA, BHARTIARTL, and LTIM.
From a technical standpoint, the Nifty remains below the short-term moving averages, with momentum indicators signaling a negative trend. Additionally, the index formed a black candle on the daily chart and closed above the previous day's closing level. On the higher side, the index faces short-term resistance at 21500. Should the index remain below this level, a further downtrend can be anticipated in the coming days. The nearest intraday support lies at 21300 levels. For a positive trend reversal, the index must close above the 21500 level.
Intraday Levels: Support: 21300-21200-21100 Resistance: 21400-21500-21600 (15 Minute Charts)
Positional Trading: Support: 21000-20500 Resistance: 21500-21835
BANK NIFTY
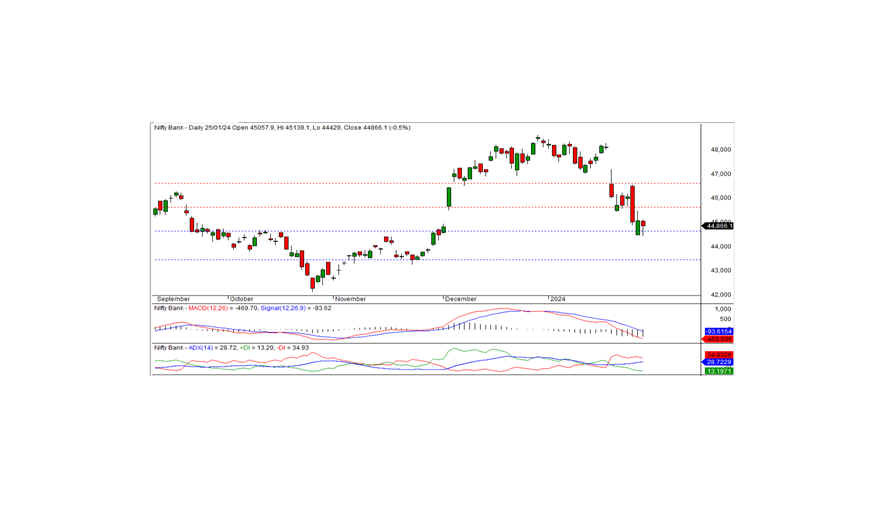
In the preceding trading session, Bank Nifty closed at 44866.15, marking a loss of -216.25 points. Technically, momentum indicators signal a negative trend, with the index remaining below the short-term and medium-term moving averages. Additionally, the index formed a black candle on the daily chart and closed inside the previous day's candle, indicating the possibility of consolidation.
On the lower side, the index finds short-term support at the 44600 level. If the index moves below this level, a further downtrend can be anticipated in the coming days. Otherwise, the index may consolidate above this level for a few more days.
For intraday traders, support levels are identified at 44850, 44500, and 44200, while resistance levels can be found at 45200, 45450, and 45700, as indicated by the 15-minute charts.
Positional traders should monitor short-term support levels at 44600-43500, with resistance observed at 45600-46600.